Intel Core i7-10700 vs Core i7-10700K Review: Is 65W Comet Lake an Option?
by Dr. Ian Cutress on January 21, 2021 10:30 AM EST- Posted in
- CPUs
- Intel
- Core i7
- Z490
- 10th Gen Core
- Comet Lake
- i7-10700K
- i7-10700
CPU Tests: Rendering
Rendering tests, compared to others, are often a little more simple to digest and automate. All the tests put out some sort of score or time, usually in an obtainable way that makes it fairly easy to extract. These tests are some of the most strenuous in our list, due to the highly threaded nature of rendering and ray-tracing, and can draw a lot of power. If a system is not properly configured to deal with the thermal requirements of the processor, the rendering benchmarks is where it would show most easily as the frequency drops over a sustained period of time. Most benchmarks in this case are re-run several times, and the key to this is having an appropriate idle/wait time between benchmarks to allow for temperatures to normalize from the last test.
Blender 2.83 LTS: Link
One of the popular tools for rendering is Blender, with it being a public open source project that anyone in the animation industry can get involved in. This extends to conferences, use in films and VR, with a dedicated Blender Institute, and everything you might expect from a professional software package (except perhaps a professional grade support package). With it being open-source, studios can customize it in as many ways as they need to get the results they require. It ends up being a big optimization target for both Intel and AMD in this regard.
For benchmarking purposes, we fell back to one rendering a frame from a detailed project. Most reviews, as we have done in the past, focus on one of the classic Blender renders, known as BMW_27. It can take anywhere from a few minutes to almost an hour on a regular system. However now that Blender has moved onto a Long Term Support model (LTS) with the latest 2.83 release, we decided to go for something different.

We use this scene, called PartyTug at 6AM by Ian Hubert, which is the official image of Blender 2.83. It is 44.3 MB in size, and uses some of the more modern compute properties of Blender. As it is more complex than the BMW scene, but uses different aspects of the compute model, time to process is roughly similar to before. We loop the scene for at least 10 minutes, taking the average time of the completions taken. Blender offers a command-line tool for batch commands, and we redirect the output into a text file.
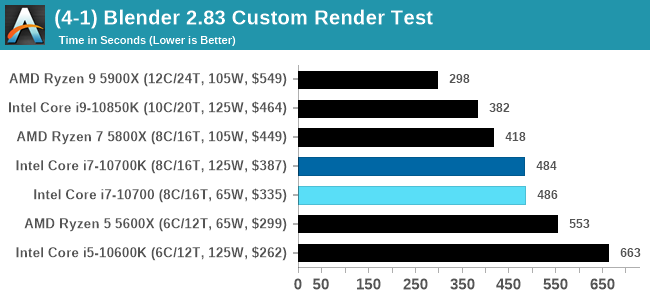
The 10700K takes a small lead.
Corona 1.3: Link
Corona is billed as a popular high-performance photorealistic rendering engine for 3ds Max, with development for Cinema 4D support as well. In order to promote the software, the developers produced a downloadable benchmark on the 1.3 version of the software, with a ray-traced scene involving a military vehicle and a lot of foliage. The software does multiple passes, calculating the scene, geometry, preconditioning and rendering, with performance measured in the time to finish the benchmark (the official metric used on their website) or in rays per second (the metric we use to offer a more linear scale).
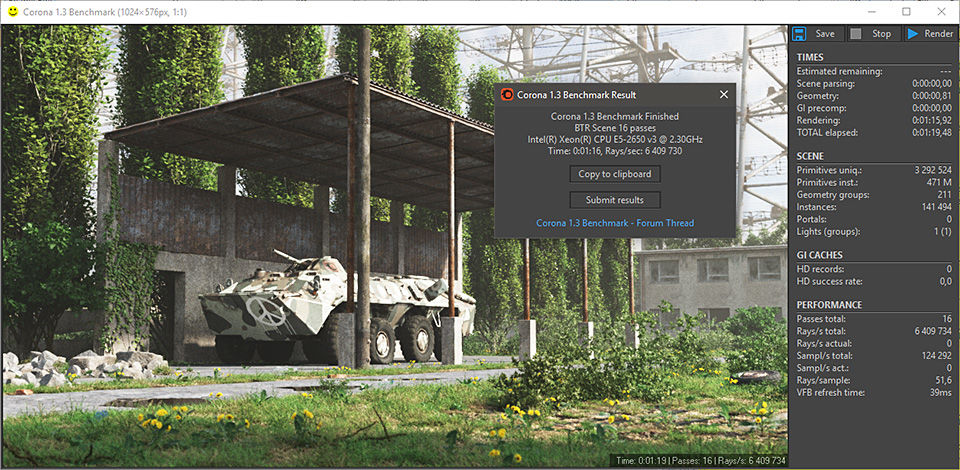
The standard benchmark provided by Corona is interface driven: the scene is calculated and displayed in front of the user, with the ability to upload the result to their online database. We got in contact with the developers, who provided us with a non-interface version that allowed for command-line entry and retrieval of the results very easily. We loop around the benchmark five times, waiting 60 seconds between each, and taking an overall average. The time to run this benchmark can be around 10 minutes on a Core i9, up to over an hour on a quad-core 2014 AMD processor or dual-core Pentium.
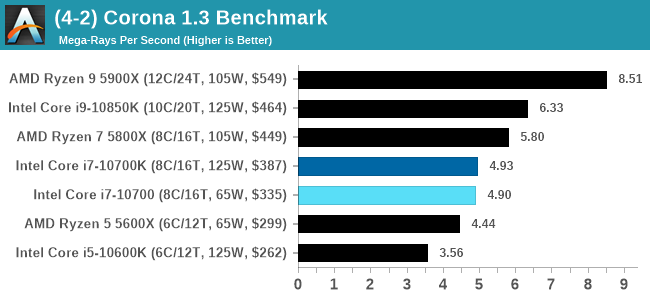
The 10700K takes a small lead.
Crysis CPU-Only Gameplay
One of the most oft used memes in computer gaming is ‘Can It Run Crysis?’. The original 2007 game, built in the Crytek engine by Crytek, was heralded as a computationally complex title for the hardware at the time and several years after, suggesting that a user needed graphics hardware from the future in order to run it. Fast forward over a decade, and the game runs fairly easily on modern GPUs.
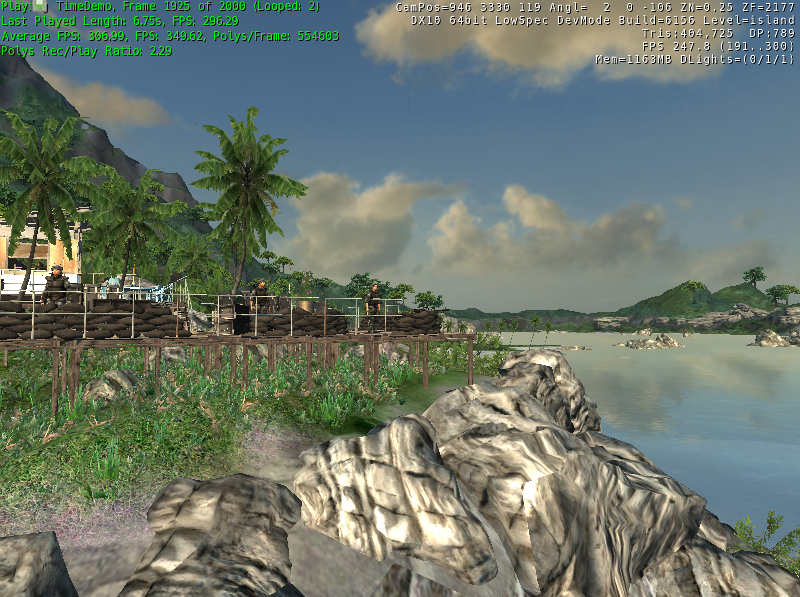
But can we also apply the same concept to pure CPU rendering? Can a CPU, on its own, render Crysis? Since 64 core processors entered the market, one can dream. So we built a benchmark to see whether the hardware can.
For this test, we’re running Crysis’ own GPU benchmark, but in CPU render mode. This is a 2000 frame test, with medium and low settings.
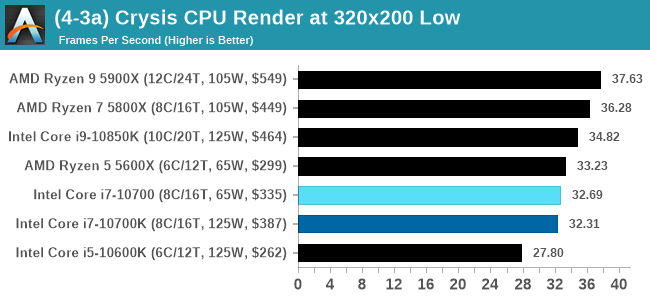
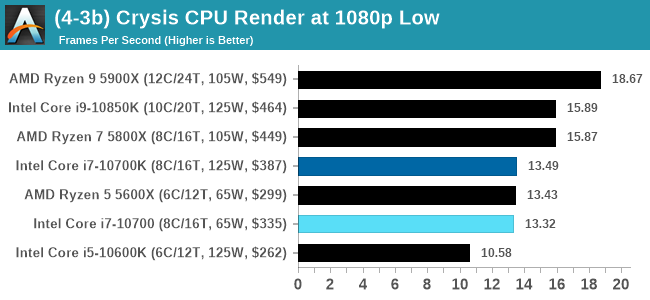
Almost playable.
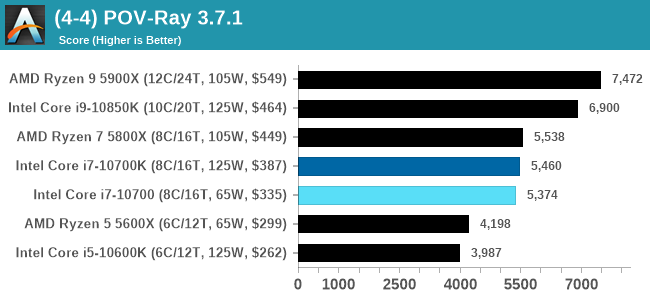
POV-Ray 3.7.1: Link
A long time benchmark staple, POV-Ray is another rendering program that is well known to load up every single thread in a system, regardless of cache and memory levels. After a long period of POV-Ray 3.7 being the latest official release, when AMD launched Ryzen the POV-Ray codebase suddenly saw a range of activity from both AMD and Intel, knowing that the software (with the built-in benchmark) would be an optimization tool for the hardware.
We had to stick a flag in the sand when it came to selecting the version that was fair to both AMD and Intel, and still relevant to end-users. Version 3.7.1 fixes a significant bug in the early 2017 code that was advised against in both Intel and AMD manuals regarding to write-after-read, leading to a nice performance boost.

The benchmark can take over 20 minutes on a slow system with few cores, or around a minute or two on a fast system, or seconds with a dual high-core count EPYC. Because POV-Ray draws a large amount of power and current, it is important to make sure the cooling is sufficient here and the system stays in its high-power state. Using a motherboard with a poor power-delivery and low airflow could create an issue that won’t be obvious in some CPU positioning if the power limit only causes a 100 MHz drop as it changes P-states.
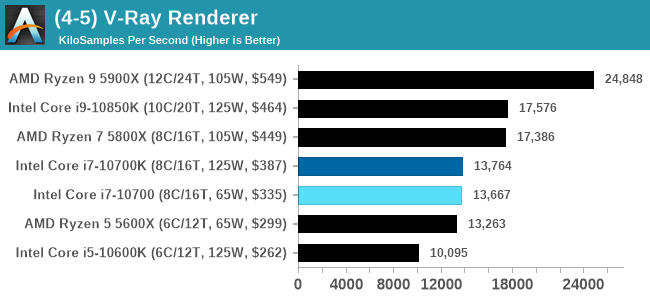
V-Ray: Link
We have a couple of renderers and ray tracers in our suite already, however V-Ray’s benchmark came through for a requested benchmark enough for us to roll it into our suite. Built by ChaosGroup, V-Ray is a 3D rendering package compatible with a number of popular commercial imaging applications, such as 3ds Max, Maya, Undreal, Cinema 4D, and Blender.

We run the standard standalone benchmark application, but in an automated fashion to pull out the result in the form of kilosamples/second. We run the test six times and take an average of the valid results.
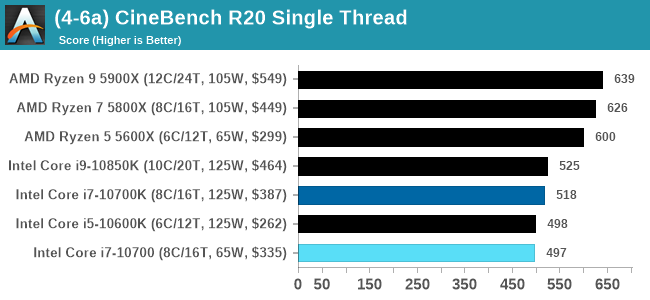
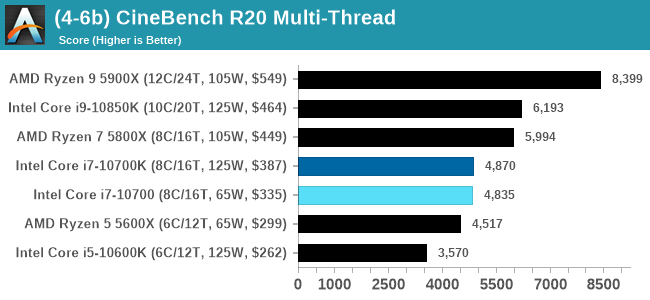
Cinebench R20: Link
Another common stable of a benchmark suite is Cinebench. Based on Cinema4D, Cinebench is a purpose built benchmark machine that renders a scene with both single and multi-threaded options. The scene is identical in both cases. The R20 version means that it targets Cinema 4D R20, a slightly older version of the software which is currently on version R21. Cinebench R20 was launched given that the R15 version had been out a long time, and despite the difference between the benchmark and the latest version of the software on which it is based, Cinebench results are often quoted a lot in marketing materials.
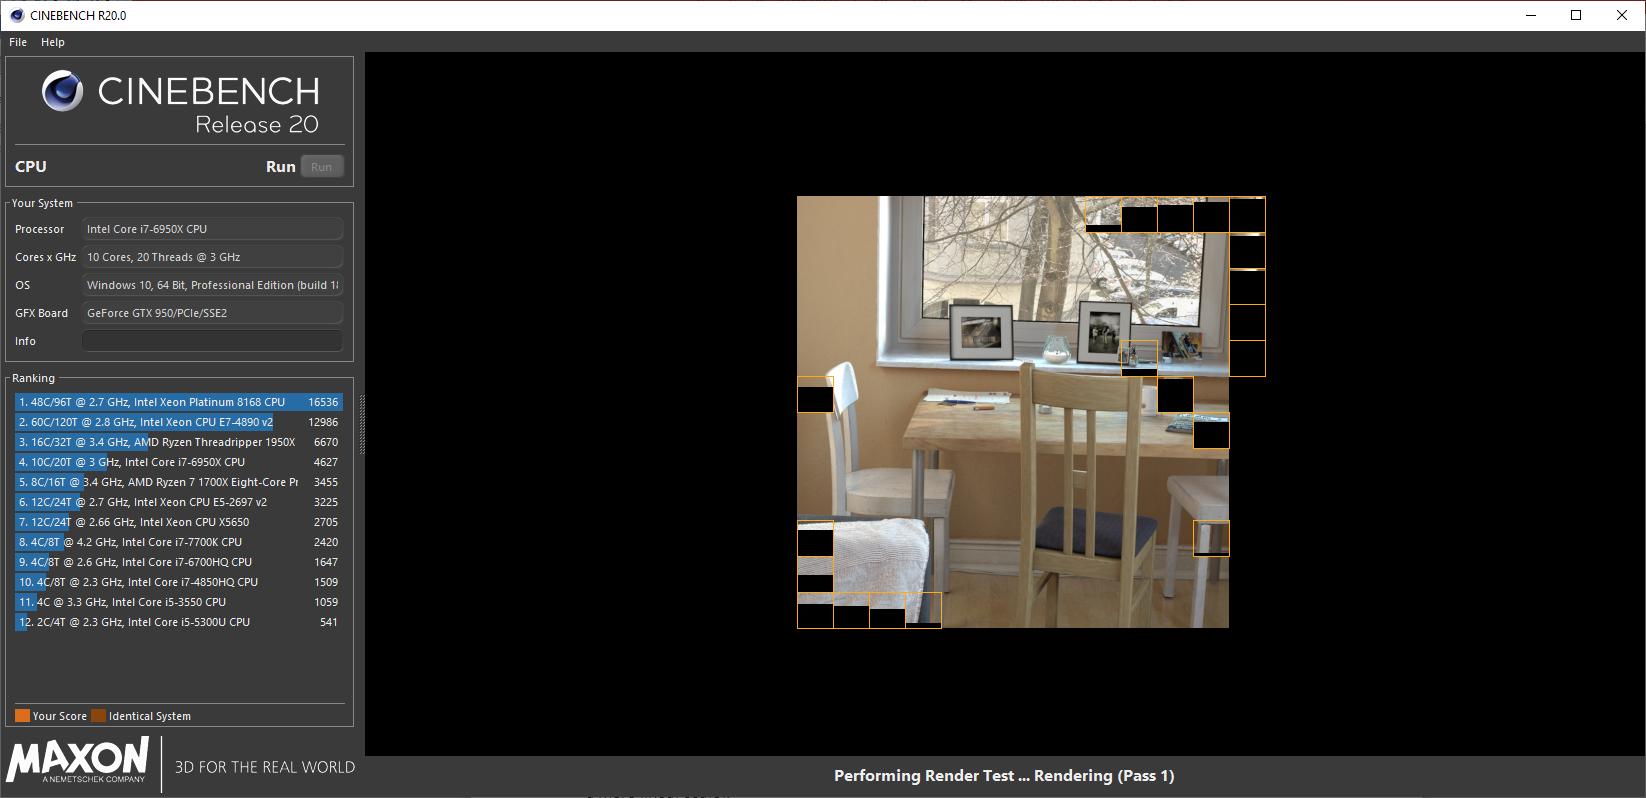
Results for Cinebench R20 are not comparable to R15 or older, because both the scene being used is different, but also the updates in the code bath. The results are output as a score from the software, which is directly proportional to the time taken. Using the benchmark flags for single CPU and multi-CPU workloads, we run the software from the command line which opens the test, runs it, and dumps the result into the console which is redirected to a text file. The test is repeated for a minimum of 10 minutes for both ST and MT, and then the runs averaged.
We are still in the process of rolling out CineBench R23 (you can see the results in our benchmark database here), but had not tested it on all the CPUs in this review at this time. It will be added to future reviews.


210 Comments
View All Comments
sjkpublic@gmail.com - Friday, January 22, 2021 - link
Yes. There is an issue with power consumption. And that is a lead into the real story. Intel has been at 14nm for 3 years now. Historically that time frame is unheard of. Some may say the complexity of the Intel CPU die is partly to blame. Some may say it is no wonder that Apple went to M1. Everyone will say Intel has dropped the ball.DieselPunk - Saturday, January 23, 2021 - link
Wow, here's a shock. Modern games get very little difference from CPUs as they are all GPU bound. And a good high end GPU is going to burn far more coal than a CPU ever will.As a gamer, WTF do I care about CPU power usage for? When I run out of coal there is still lots of gasoline 😎
headmaster - Saturday, January 23, 2021 - link
it's a great post admin thanks for ithttps://www.snapseedforpcguide.co/
yankeeDDL - Saturday, January 23, 2021 - link
Is it fair to say that the 10700 is on par (at best) or slower (in most multi-threaded scenarios) than the Ryzen 5600X, despite using roughly 2X the power?Makste - Saturday, January 23, 2021 - link
Put the number of cores into consideration as another factor, and then come up with your own conclusion.HarkPtooie - Sunday, January 24, 2021 - link
I registered just to post this: you're nuts.I just measured my "65W" i7-10700 non-K while stress testing it, and it eats 165 W at the wall plug. 64GB RAM, good quality Corsair 450W PSU.
Then I compared to to my "65W" Ryzen 3700X, 32GB RAM = 157 W. That one has an expensive fanless Seasonic 500W PSU which nominally better efficiency at these power draw levels.
So the difference is 10W and may as well be attributed to PSU quality, RAM consumption and whatnot.
If you are going to make wild speculations whose veracity anyone can check, you might want to go over your material a bit better.
Smell This - Sunday, January 24, 2021 - link
LOL
mmm ... Let me see.
Three feature writers at AT versus some 'anecdotal' FUD-peddling troll on the Internet. The Universe will make the call.
The 65w 8c/16t AMD Ryzen 3700X, fully loaded, pulls 90w. There is also a fancy multi-colored chart for you!
https://www.anandtech.com/show/14605/the-and-ryzen...
The i7-10700, in this article, pulls 197w to 214w. Ooops.
Psssst ___ By the way, my local MicroCenter (Duluth) offers the AMD Ryzen 3700X at $299 after $30 off, and the i7-10700 for $280 after $120 off. My-my-my, how the mighty has fallen . . .
HarkPtooie - Tuesday, January 26, 2021 - link
So you are saying that their wattmeters are right and mine is wrong because... appeal to authority?It may be that my Ryzen draws 90 W, but from the looks of it, the i7 is not far off. 10 more watts, not 130.
The universe will indeed make the call.
Spunjji - Wednesday, January 27, 2021 - link
Plausible explanations for the discrepancy, in order of likelihood:1) The unspecified stress test you're using isn't actually stressing the 10700 very heavily.
2) You're not measuring like-for-like in some other way - be it components or configuration.
3) Your wattmeter is poorly calibrated (This level would be a reach).
4) You're simply not being honest (I don't like to assume this, but you seem aggressive about people questioning your implausible conclusions).
Implausible explanations:
1) Every review on the internet performed with calibrated equipment, specified configurations and specified software loads is somehow wrong and you are right.
Everett F Sargent - Wednesday, January 27, 2021 - link
I'll go as far as requiring/requesting/asking for their MB model (an exact model number and manufacturer thereof). Without that one key piece of information, I have concluded the following: Using a Z490 or other relatively high end LGA 1200 MB indicates that the i7-10700 will run at or significantly above 200W in continuous 247 operation.Remember this user claims to be using a 450W PSU, so very likely not a Z490 MB, so indicative of a rather low end system (e. g. no medium to high end GPU, not that that matters as these are essentially CPU tests unless stated otherwise in this review).
I believe their power number but I don't believe that they are testing on a medium to high end LGA 1200 MB. In other words it is all about the MB default settings for PL1, PL2 and Tau and not the CPU itself.