Intel Core i7-10700 vs Core i7-10700K Review: Is 65W Comet Lake an Option?
by Dr. Ian Cutress on January 21, 2021 10:30 AM EST- Posted in
- CPUs
- Intel
- Core i7
- Z490
- 10th Gen Core
- Comet Lake
- i7-10700K
- i7-10700
CPU Tests: Encoding
One of the interesting elements on modern processors is encoding performance. This covers two main areas: encryption/decryption for secure data transfer, and video transcoding from one video format to another.
In the encrypt/decrypt scenario, how data is transferred and by what mechanism is pertinent to on-the-fly encryption of sensitive data - a process by which more modern devices are leaning to for software security.
Video transcoding as a tool to adjust the quality, file size and resolution of a video file has boomed in recent years, such as providing the optimum video for devices before consumption, or for game streamers who are wanting to upload the output from their video camera in real-time. As we move into live 3D video, this task will only get more strenuous, and it turns out that the performance of certain algorithms is a function of the input/output of the content.
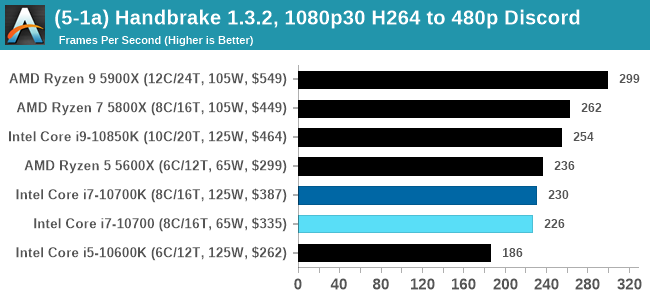
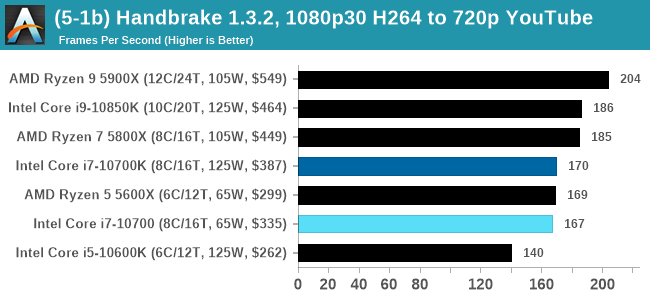
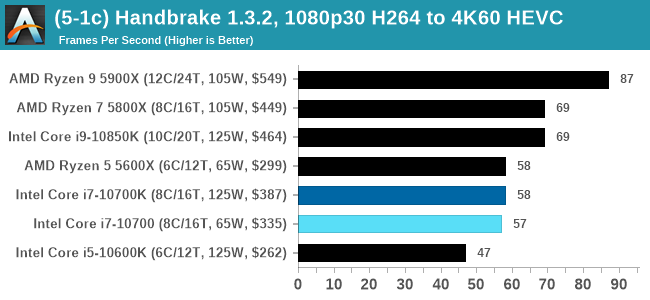
HandBrake 1.32: Link
Video transcoding (both encode and decode) is a hot topic in performance metrics as more and more content is being created. First consideration is the standard in which the video is encoded, which can be lossless or lossy, trade performance for file-size, trade quality for file-size, or all of the above can increase encoding rates to help accelerate decoding rates. Alongside Google's favorite codecs, VP9 and AV1, there are others that are prominent: H264, the older codec, is practically everywhere and is designed to be optimized for 1080p video, and HEVC (or H.265) that is aimed to provide the same quality as H264 but at a lower file-size (or better quality for the same size). HEVC is important as 4K is streamed over the air, meaning less bits need to be transferred for the same quality content. There are other codecs coming to market designed for specific use cases all the time.
Handbrake is a favored tool for transcoding, with the later versions using copious amounts of newer APIs to take advantage of co-processors, like GPUs. It is available on Windows via an interface or can be accessed through the command-line, with the latter making our testing easier, with a redirection operator for the console output.
We take the compiled version of this 16-minute YouTube video about Russian CPUs at 1080p30 h264 and convert into three different files: (1) 480p30 ‘Discord’, (2) 720p30 ‘YouTube’, and (3) 4K60 HEVC.
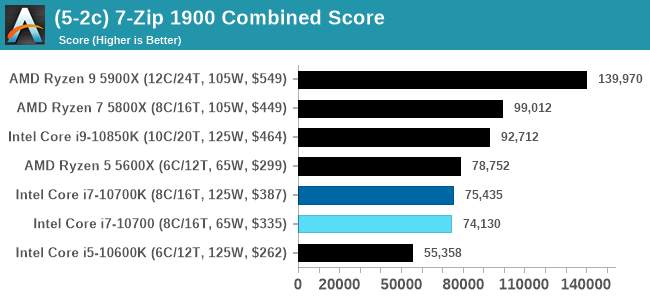
7-Zip 1900: Link
The first compression benchmark tool we use is the open-source 7-zip, which typically offers good scaling across multiple cores. 7-zip is the compression tool most cited by readers as one they would rather see benchmarks on, and the program includes a built-in benchmark tool for both compression and decompression.
The tool can either be run from inside the software or through the command line. We take the latter route as it is easier to automate, obtain results, and put through our process. The command line flags available offer an option for repeated runs, and the output provides the average automatically through the console. We direct this output into a text file and regex the required values for compression, decompression, and a combined score.
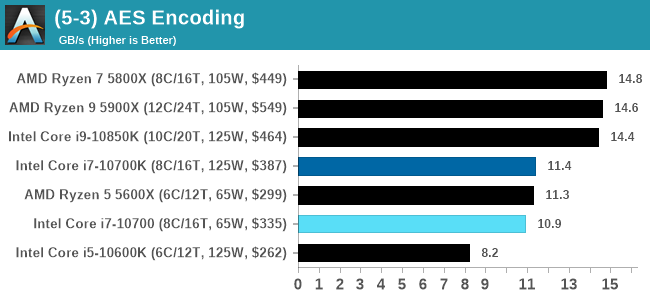
AES Encoding
Algorithms using AES coding have spread far and wide as a ubiquitous tool for encryption. Again, this is another CPU limited test, and modern CPUs have special AES pathways to accelerate their performance. We often see scaling in both frequency and cores with this benchmark. We use the latest version of TrueCrypt and run its benchmark mode over 1GB of in-DRAM data. Results shown are the GB/s average of encryption and decryption.
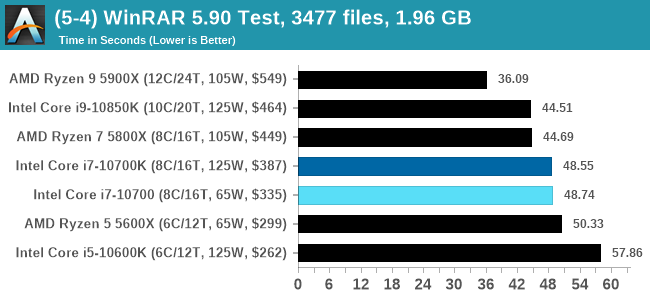
WinRAR 5.90: Link
For the 2020 test suite, we move to the latest version of WinRAR in our compression test. WinRAR in some quarters is more user friendly that 7-Zip, hence its inclusion. Rather than use a benchmark mode as we did with 7-Zip, here we take a set of files representative of a generic stack
- 33 video files , each 30 seconds, in 1.37 GB,
- 2834 smaller website files in 370 folders in 150 MB,
- 100 Beat Saber music tracks and input files, for 451 MB
This is a mixture of compressible and incompressible formats. The results shown are the time taken to encode the file. Due to DRAM caching, we run the test for 20 minutes times and take the average of the last five runs when the benchmark is in a steady state.

For automation, we use AHK’s internal timing tools from initiating the workload until the window closes signifying the end. This means the results are contained within AHK, with an average of the last 5 results being easy enough to calculate.


210 Comments
View All Comments
sjkpublic@gmail.com - Friday, January 22, 2021 - link
Yes. There is an issue with power consumption. And that is a lead into the real story. Intel has been at 14nm for 3 years now. Historically that time frame is unheard of. Some may say the complexity of the Intel CPU die is partly to blame. Some may say it is no wonder that Apple went to M1. Everyone will say Intel has dropped the ball.DieselPunk - Saturday, January 23, 2021 - link
Wow, here's a shock. Modern games get very little difference from CPUs as they are all GPU bound. And a good high end GPU is going to burn far more coal than a CPU ever will.As a gamer, WTF do I care about CPU power usage for? When I run out of coal there is still lots of gasoline 😎
headmaster - Saturday, January 23, 2021 - link
it's a great post admin thanks for ithttps://www.snapseedforpcguide.co/
yankeeDDL - Saturday, January 23, 2021 - link
Is it fair to say that the 10700 is on par (at best) or slower (in most multi-threaded scenarios) than the Ryzen 5600X, despite using roughly 2X the power?Makste - Saturday, January 23, 2021 - link
Put the number of cores into consideration as another factor, and then come up with your own conclusion.HarkPtooie - Sunday, January 24, 2021 - link
I registered just to post this: you're nuts.I just measured my "65W" i7-10700 non-K while stress testing it, and it eats 165 W at the wall plug. 64GB RAM, good quality Corsair 450W PSU.
Then I compared to to my "65W" Ryzen 3700X, 32GB RAM = 157 W. That one has an expensive fanless Seasonic 500W PSU which nominally better efficiency at these power draw levels.
So the difference is 10W and may as well be attributed to PSU quality, RAM consumption and whatnot.
If you are going to make wild speculations whose veracity anyone can check, you might want to go over your material a bit better.
Smell This - Sunday, January 24, 2021 - link
LOL
mmm ... Let me see.
Three feature writers at AT versus some 'anecdotal' FUD-peddling troll on the Internet. The Universe will make the call.
The 65w 8c/16t AMD Ryzen 3700X, fully loaded, pulls 90w. There is also a fancy multi-colored chart for you!
https://www.anandtech.com/show/14605/the-and-ryzen...
The i7-10700, in this article, pulls 197w to 214w. Ooops.
Psssst ___ By the way, my local MicroCenter (Duluth) offers the AMD Ryzen 3700X at $299 after $30 off, and the i7-10700 for $280 after $120 off. My-my-my, how the mighty has fallen . . .
HarkPtooie - Tuesday, January 26, 2021 - link
So you are saying that their wattmeters are right and mine is wrong because... appeal to authority?It may be that my Ryzen draws 90 W, but from the looks of it, the i7 is not far off. 10 more watts, not 130.
The universe will indeed make the call.
Spunjji - Wednesday, January 27, 2021 - link
Plausible explanations for the discrepancy, in order of likelihood:1) The unspecified stress test you're using isn't actually stressing the 10700 very heavily.
2) You're not measuring like-for-like in some other way - be it components or configuration.
3) Your wattmeter is poorly calibrated (This level would be a reach).
4) You're simply not being honest (I don't like to assume this, but you seem aggressive about people questioning your implausible conclusions).
Implausible explanations:
1) Every review on the internet performed with calibrated equipment, specified configurations and specified software loads is somehow wrong and you are right.
Everett F Sargent - Wednesday, January 27, 2021 - link
I'll go as far as requiring/requesting/asking for their MB model (an exact model number and manufacturer thereof). Without that one key piece of information, I have concluded the following: Using a Z490 or other relatively high end LGA 1200 MB indicates that the i7-10700 will run at or significantly above 200W in continuous 247 operation.Remember this user claims to be using a 450W PSU, so very likely not a Z490 MB, so indicative of a rather low end system (e. g. no medium to high end GPU, not that that matters as these are essentially CPU tests unless stated otherwise in this review).
I believe their power number but I don't believe that they are testing on a medium to high end LGA 1200 MB. In other words it is all about the MB default settings for PL1, PL2 and Tau and not the CPU itself.