Intel Core i7-10700 vs Core i7-10700K Review: Is 65W Comet Lake an Option?
by Dr. Ian Cutress on January 21, 2021 10:30 AM EST- Posted in
- CPUs
- Intel
- Core i7
- Z490
- 10th Gen Core
- Comet Lake
- i7-10700K
- i7-10700
CPU Tests: Synthetic and SPEC
Most of the people in our industry have a love/hate relationship when it comes to synthetic tests. On the one hand, they’re often good for quick summaries of performance and are easy to use, but most of the time the tests aren’t related to any real software. Synthetic tests are often very good at burrowing down to a specific set of instructions and maximizing the performance out of those. Due to requests from a number of our readers, we have the following synthetic tests.
Linux OpenSSL Speed: SHA256
One of our readers reached out in early 2020 and stated that he was interested in looking at OpenSSL hashing rates in Linux. Luckily OpenSSL in Linux has a function called ‘speed’ that allows the user to determine how fast the system is for any given hashing algorithm, as well as signing and verifying messages.
OpenSSL offers a lot of algorithms to choose from, and based on a quick Twitter poll, we narrowed it down to the following:
- rsa2048 sign and rsa2048 verify
- sha256 at 8K block size
- md5 at 8K block size
For each of these tests, we run them in single thread and multithreaded mode. All the graphs are in our benchmark database, Bench, and we use the sha256 results in published reviews.
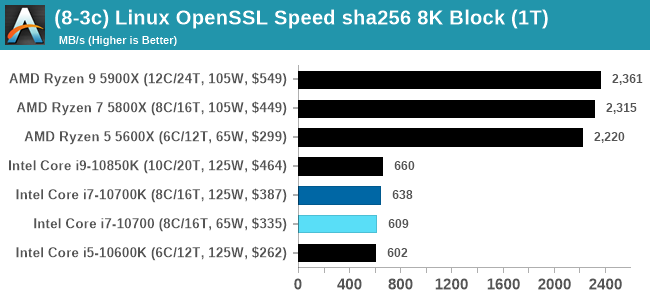
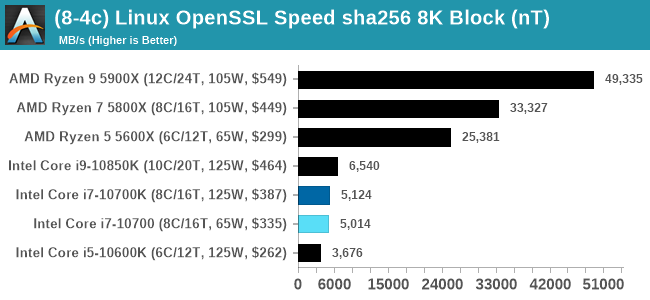
Specifically on the sha256 tests, both AMD and Via pull out a lead due to a dedicated sha256 compute block in each core. Intel is enabling accelerated sha256 via AVX-512 to its processors at a later date.
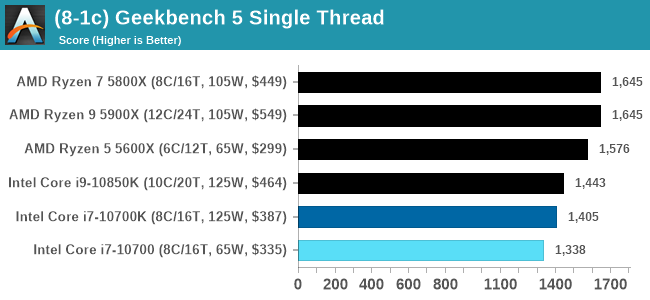
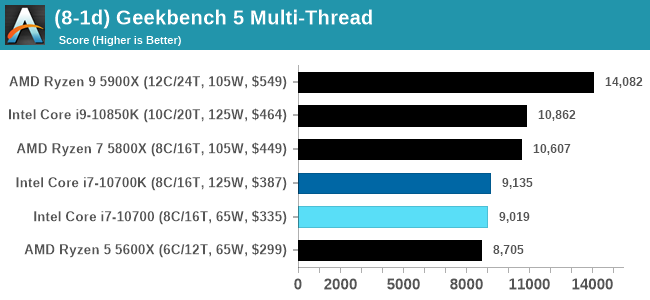
GeekBench 5: Link
As a common tool for cross-platform testing between mobile, PC, and Mac, GeekBench is an ultimate exercise in synthetic testing across a range of algorithms looking for peak throughput. Tests include encryption, compression, fast Fourier transform, memory operations, n-body physics, matrix operations, histogram manipulation, and HTML parsing.
I’m including this test due to popular demand, although the results do come across as overly synthetic, and a lot of users often put a lot of weight behind the test due to the fact that it is compiled across different platforms (although with different compilers).
We have both GB5 and GB4 results in our benchmark database. GB5 was introduced to our test suite after already having tested ~25 CPUs, and so the results are a little sporadic by comparison. These spots will be filled in when we retest any of the CPUs.
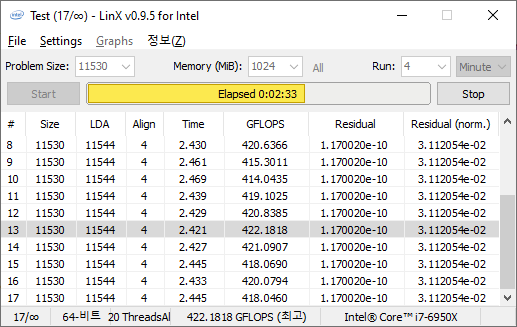
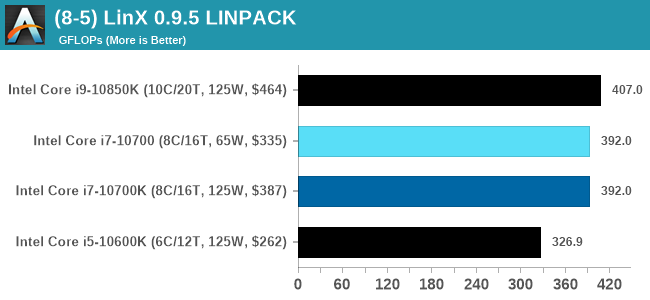
LinX 0.9.5 LINPACK
One of the benchmarks I’ve been after for a while is just something that outputs a very simple GFLOPs FP64 number, or in the case of AI I’d like to get a value for TOPs at a given level of quantization (FP32/FP16/INT8 etc). The most popular tool for doing this on supercomputers is a form of LINPACK, however for consumer systems it’s a case of making sure that the software is optimized for each CPU.
LinX has been a popular interface for LINPACK on Windows for a number of years. However the last official version was 0.6.5, launched in 2015, before the latest Ryzen hardware came into being. HWTips in Korea has been updating LinX and has separated out into two versions, one for Intel and one for AMD, and both have reached version 0.9.5. Unfortunately the AMD version is still a work in progress, as it doesn’t work on Zen 2.
There does exist a program called Linpack Extreme 1.1.3, which claims to be updated to use the latest version of the Intel Math Kernel Libraries. It works great, however the way the interface has been designed means that it can’t be automated for our uses, so we can’t use it.
For LinX 0.9.5, there also is a difficulty of what parameters to put into LINPACK. The two main parameters are problem size and time – choose a problem size too small, and you won’t get peak performance. Choose it too large, and the calculation can go on for hours. To that end, we use the following algorithms as a compromise:
- Memory Use = Floor(1000 + 20*sqrt(threads)) MB
- Time = Floor(10+sqrt(threads)) minutes
For a 4 thread system, we use 1040 MB and run for 12 minutes.
For a 128 thread system, we use 1226 MB and run for 21 minutes.
CPU Tests: SPEC
SPEC2017 and SPEC2006 is a series of standardized tests used to probe the overall performance between different systems, different architectures, different microarchitectures, and setups. The code has to be compiled, and then the results can be submitted to an online database for comparison. It covers a range of integer and floating point workloads, and can be very optimized for each CPU, so it is important to check how the benchmarks are being compiled and run.
We run the tests in a harness built through Windows Subsystem for Linux, developed by our own Andrei Frumusanu. WSL has some odd quirks, with one test not running due to a WSL fixed stack size, but for like-for-like testing is good enough. SPEC2006 is deprecated in favor of 2017, but remains an interesting comparison point in our data. Because our scores aren’t official submissions, as per SPEC guidelines we have to declare them as internal estimates from our part.
For compilers, we use LLVM both for C/C++ and Fortan tests, and for Fortran we’re using the Flang compiler. The rationale of using LLVM over GCC is better cross-platform comparisons to platforms that have only have LLVM support and future articles where we’ll investigate this aspect more. We’re not considering closed-sourced compilers such as MSVC or ICC.
clang version 10.0.0
clang version 7.0.1 (ssh://git@github.com/flang-compiler/flang-driver.git
24bd54da5c41af04838bbe7b68f830840d47fc03)
-Ofast -fomit-frame-pointer
-march=x86-64
-mtune=core-avx2
-mfma -mavx -mavx2
Our compiler flags are straightforward, with basic –Ofast and relevant ISA switches to allow for AVX2 instructions. We decided to build our SPEC binaries on AVX2, which puts a limit on Haswell as how old we can go before the testing will fall over. This also means we don’t have AVX512 binaries, primarily because in order to get the best performance, the AVX-512 intrinsic should be packed by a proper expert, as with our AVX-512 benchmark. All of the major vendors, AMD, Intel, and Arm, all support the way in which we are testing SPEC.
To note, the requirements for the SPEC licence state that any benchmark results from SPEC have to be labelled ‘estimated’ until they are verified on the SPEC website as a meaningful representation of the expected performance. This is most often done by the big companies and OEMs to showcase performance to customers, however is quite over the top for what we do as reviewers.
For each of the SPEC targets we are doing, SPEC2006 rate-1, SPEC2017 speed-1, and SPEC2017 speed-N, rather than publish all the separate test data in our reviews, we are going to condense it down into a few interesting data points. The full per-test values are in our benchmark database.
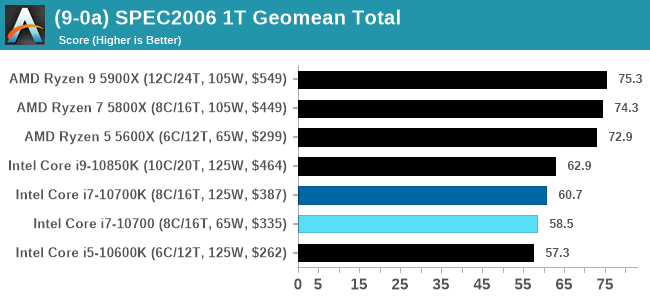
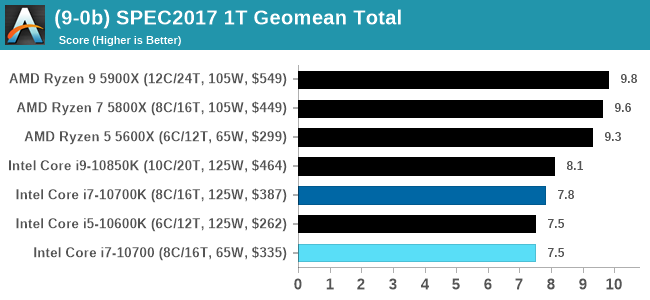
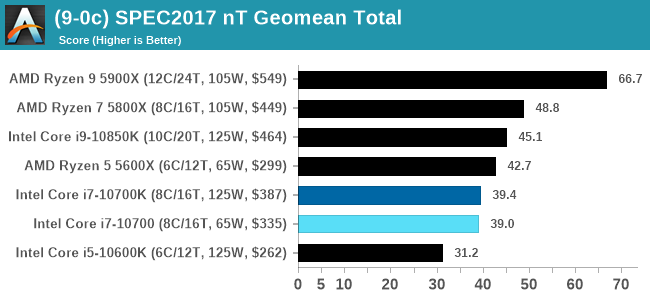
Both of the 8-core Core i7 parts here are handily beaten by AMD's 6-core Ryzen 5 in ST and MT.


210 Comments
View All Comments
sjkpublic@gmail.com - Friday, January 22, 2021 - link
Yes. There is an issue with power consumption. And that is a lead into the real story. Intel has been at 14nm for 3 years now. Historically that time frame is unheard of. Some may say the complexity of the Intel CPU die is partly to blame. Some may say it is no wonder that Apple went to M1. Everyone will say Intel has dropped the ball.DieselPunk - Saturday, January 23, 2021 - link
Wow, here's a shock. Modern games get very little difference from CPUs as they are all GPU bound. And a good high end GPU is going to burn far more coal than a CPU ever will.As a gamer, WTF do I care about CPU power usage for? When I run out of coal there is still lots of gasoline 😎
headmaster - Saturday, January 23, 2021 - link
it's a great post admin thanks for ithttps://www.snapseedforpcguide.co/
yankeeDDL - Saturday, January 23, 2021 - link
Is it fair to say that the 10700 is on par (at best) or slower (in most multi-threaded scenarios) than the Ryzen 5600X, despite using roughly 2X the power?Makste - Saturday, January 23, 2021 - link
Put the number of cores into consideration as another factor, and then come up with your own conclusion.HarkPtooie - Sunday, January 24, 2021 - link
I registered just to post this: you're nuts.I just measured my "65W" i7-10700 non-K while stress testing it, and it eats 165 W at the wall plug. 64GB RAM, good quality Corsair 450W PSU.
Then I compared to to my "65W" Ryzen 3700X, 32GB RAM = 157 W. That one has an expensive fanless Seasonic 500W PSU which nominally better efficiency at these power draw levels.
So the difference is 10W and may as well be attributed to PSU quality, RAM consumption and whatnot.
If you are going to make wild speculations whose veracity anyone can check, you might want to go over your material a bit better.
Smell This - Sunday, January 24, 2021 - link
LOL
mmm ... Let me see.
Three feature writers at AT versus some 'anecdotal' FUD-peddling troll on the Internet. The Universe will make the call.
The 65w 8c/16t AMD Ryzen 3700X, fully loaded, pulls 90w. There is also a fancy multi-colored chart for you!
https://www.anandtech.com/show/14605/the-and-ryzen...
The i7-10700, in this article, pulls 197w to 214w. Ooops.
Psssst ___ By the way, my local MicroCenter (Duluth) offers the AMD Ryzen 3700X at $299 after $30 off, and the i7-10700 for $280 after $120 off. My-my-my, how the mighty has fallen . . .
HarkPtooie - Tuesday, January 26, 2021 - link
So you are saying that their wattmeters are right and mine is wrong because... appeal to authority?It may be that my Ryzen draws 90 W, but from the looks of it, the i7 is not far off. 10 more watts, not 130.
The universe will indeed make the call.
Spunjji - Wednesday, January 27, 2021 - link
Plausible explanations for the discrepancy, in order of likelihood:1) The unspecified stress test you're using isn't actually stressing the 10700 very heavily.
2) You're not measuring like-for-like in some other way - be it components or configuration.
3) Your wattmeter is poorly calibrated (This level would be a reach).
4) You're simply not being honest (I don't like to assume this, but you seem aggressive about people questioning your implausible conclusions).
Implausible explanations:
1) Every review on the internet performed with calibrated equipment, specified configurations and specified software loads is somehow wrong and you are right.
Everett F Sargent - Wednesday, January 27, 2021 - link
I'll go as far as requiring/requesting/asking for their MB model (an exact model number and manufacturer thereof). Without that one key piece of information, I have concluded the following: Using a Z490 or other relatively high end LGA 1200 MB indicates that the i7-10700 will run at or significantly above 200W in continuous 247 operation.Remember this user claims to be using a 450W PSU, so very likely not a Z490 MB, so indicative of a rather low end system (e. g. no medium to high end GPU, not that that matters as these are essentially CPU tests unless stated otherwise in this review).
I believe their power number but I don't believe that they are testing on a medium to high end LGA 1200 MB. In other words it is all about the MB default settings for PL1, PL2 and Tau and not the CPU itself.