Intel Core i7-10700 vs Core i7-10700K Review: Is 65W Comet Lake an Option?
by Dr. Ian Cutress on January 21, 2021 10:30 AM EST- Posted in
- CPUs
- Intel
- Core i7
- Z490
- 10th Gen Core
- Comet Lake
- i7-10700K
- i7-10700
CPU Tests: Rendering
Rendering tests, compared to others, are often a little more simple to digest and automate. All the tests put out some sort of score or time, usually in an obtainable way that makes it fairly easy to extract. These tests are some of the most strenuous in our list, due to the highly threaded nature of rendering and ray-tracing, and can draw a lot of power. If a system is not properly configured to deal with the thermal requirements of the processor, the rendering benchmarks is where it would show most easily as the frequency drops over a sustained period of time. Most benchmarks in this case are re-run several times, and the key to this is having an appropriate idle/wait time between benchmarks to allow for temperatures to normalize from the last test.
Blender 2.83 LTS: Link
One of the popular tools for rendering is Blender, with it being a public open source project that anyone in the animation industry can get involved in. This extends to conferences, use in films and VR, with a dedicated Blender Institute, and everything you might expect from a professional software package (except perhaps a professional grade support package). With it being open-source, studios can customize it in as many ways as they need to get the results they require. It ends up being a big optimization target for both Intel and AMD in this regard.
For benchmarking purposes, we fell back to one rendering a frame from a detailed project. Most reviews, as we have done in the past, focus on one of the classic Blender renders, known as BMW_27. It can take anywhere from a few minutes to almost an hour on a regular system. However now that Blender has moved onto a Long Term Support model (LTS) with the latest 2.83 release, we decided to go for something different.

We use this scene, called PartyTug at 6AM by Ian Hubert, which is the official image of Blender 2.83. It is 44.3 MB in size, and uses some of the more modern compute properties of Blender. As it is more complex than the BMW scene, but uses different aspects of the compute model, time to process is roughly similar to before. We loop the scene for at least 10 minutes, taking the average time of the completions taken. Blender offers a command-line tool for batch commands, and we redirect the output into a text file.
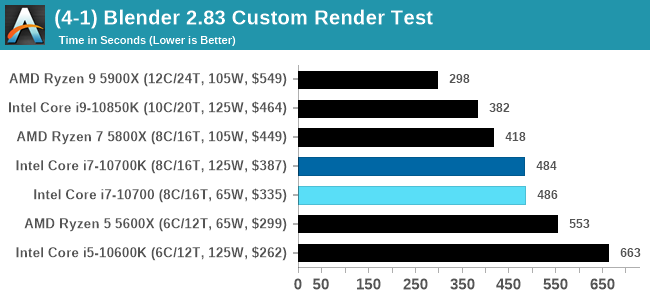
The 10700K takes a small lead.
Corona 1.3: Link
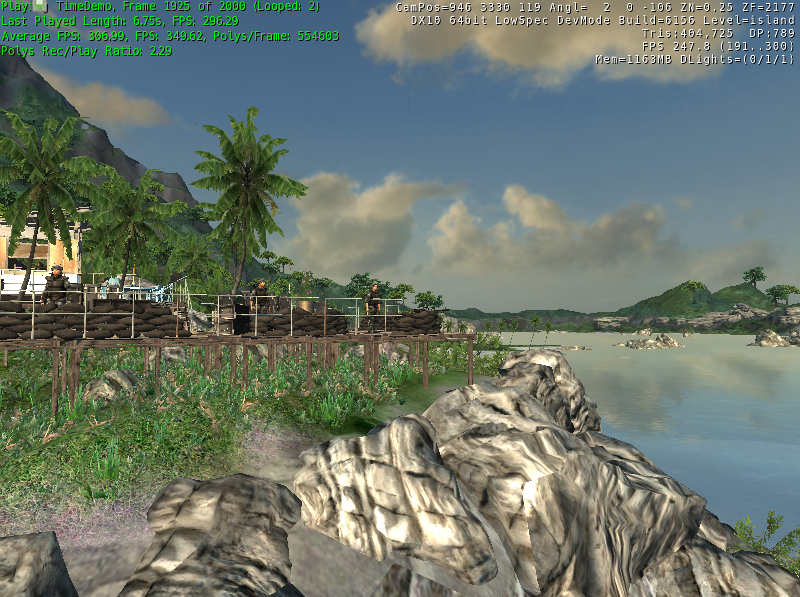
Corona is billed as a popular high-performance photorealistic rendering engine for 3ds Max, with development for Cinema 4D support as well. In order to promote the software, the developers produced a downloadable benchmark on the 1.3 version of the software, with a ray-traced scene involving a military vehicle and a lot of foliage. The software does multiple passes, calculating the scene, geometry, preconditioning and rendering, with performance measured in the time to finish the benchmark (the official metric used on their website) or in rays per second (the metric we use to offer a more linear scale).
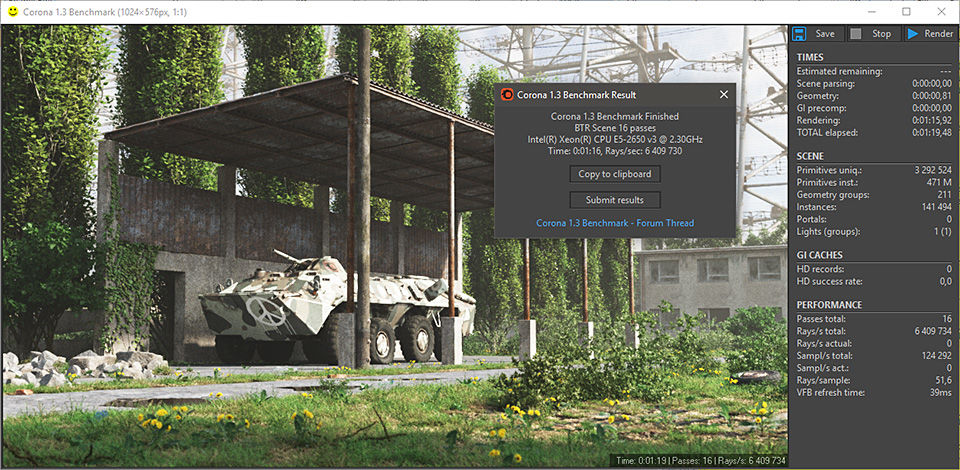
The standard benchmark provided by Corona is interface driven: the scene is calculated and displayed in front of the user, with the ability to upload the result to their online database. We got in contact with the developers, who provided us with a non-interface version that allowed for command-line entry and retrieval of the results very easily. We loop around the benchmark five times, waiting 60 seconds between each, and taking an overall average. The time to run this benchmark can be around 10 minutes on a Core i9, up to over an hour on a quad-core 2014 AMD processor or dual-core Pentium.
The 10700K takes a small lead.
Crysis CPU-Only Gameplay
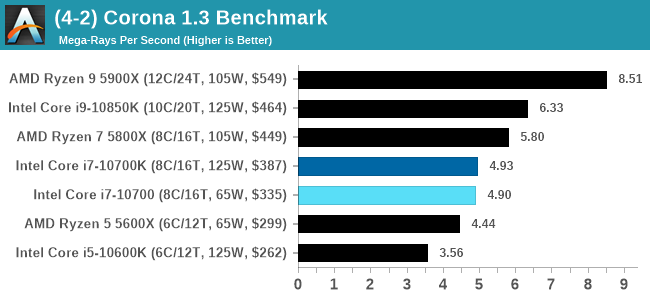
One of the most oft used memes in computer gaming is ‘Can It Run Crysis?’. The original 2007 game, built in the Crytek engine by Crytek, was heralded as a computationally complex title for the hardware at the time and several years after, suggesting that a user needed graphics hardware from the future in order to run it. Fast forward over a decade, and the game runs fairly easily on modern GPUs.
But can we also apply the same concept to pure CPU rendering? Can a CPU, on its own, render Crysis? Since 64 core processors entered the market, one can dream. So we built a benchmark to see whether the hardware can.
For this test, we’re running Crysis’ own GPU benchmark, but in CPU render mode. This is a 2000 frame test, with medium and low settings.
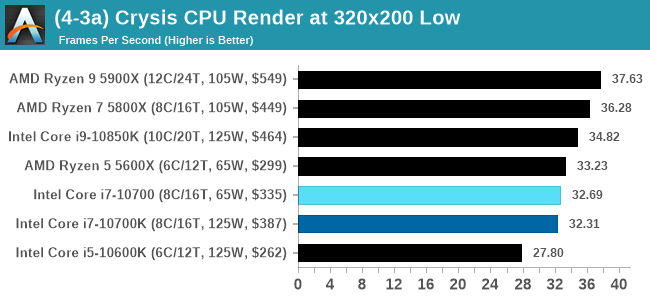
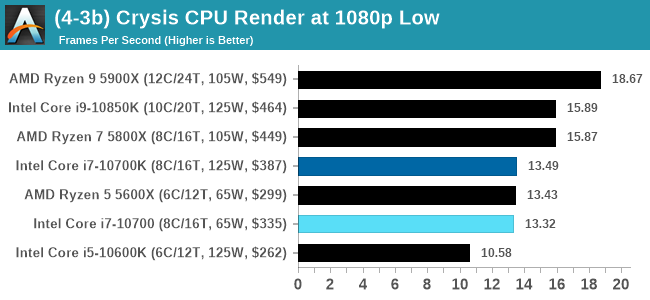
Almost playable.
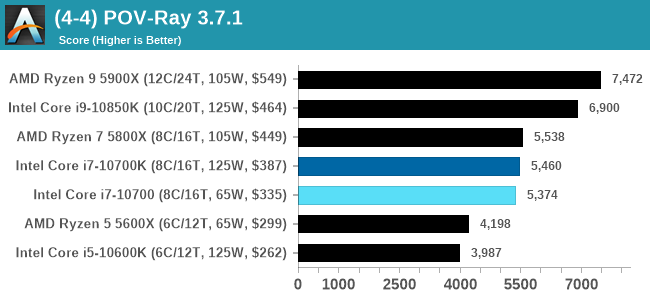
POV-Ray 3.7.1: Link
A long time benchmark staple, POV-Ray is another rendering program that is well known to load up every single thread in a system, regardless of cache and memory levels. After a long period of POV-Ray 3.7 being the latest official release, when AMD launched Ryzen the POV-Ray codebase suddenly saw a range of activity from both AMD and Intel, knowing that the software (with the built-in benchmark) would be an optimization tool for the hardware.
We had to stick a flag in the sand when it came to selecting the version that was fair to both AMD and Intel, and still relevant to end-users. Version 3.7.1 fixes a significant bug in the early 2017 code that was advised against in both Intel and AMD manuals regarding to write-after-read, leading to a nice performance boost.

The benchmark can take over 20 minutes on a slow system with few cores, or around a minute or two on a fast system, or seconds with a dual high-core count EPYC. Because POV-Ray draws a large amount of power and current, it is important to make sure the cooling is sufficient here and the system stays in its high-power state. Using a motherboard with a poor power-delivery and low airflow could create an issue that won’t be obvious in some CPU positioning if the power limit only causes a 100 MHz drop as it changes P-states.
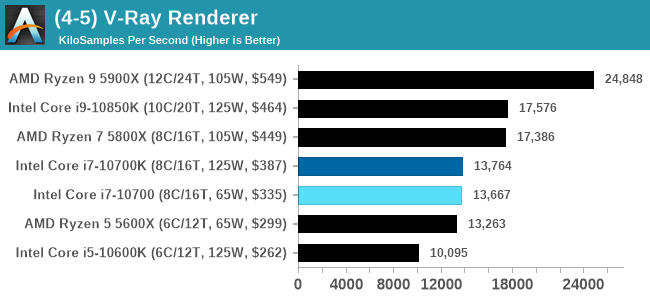
V-Ray: Link
We have a couple of renderers and ray tracers in our suite already, however V-Ray’s benchmark came through for a requested benchmark enough for us to roll it into our suite. Built by ChaosGroup, V-Ray is a 3D rendering package compatible with a number of popular commercial imaging applications, such as 3ds Max, Maya, Undreal, Cinema 4D, and Blender.

We run the standard standalone benchmark application, but in an automated fashion to pull out the result in the form of kilosamples/second. We run the test six times and take an average of the valid results.
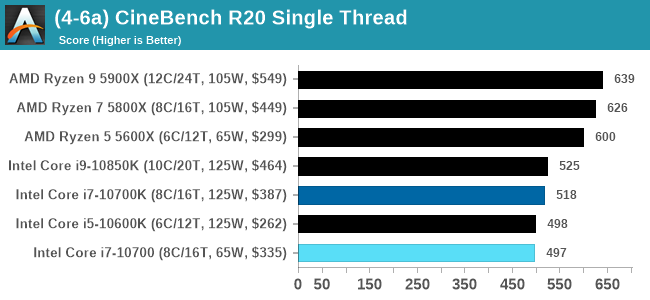
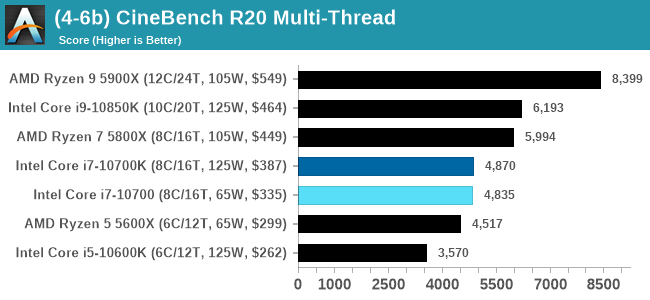
Cinebench R20: Link
Another common stable of a benchmark suite is Cinebench. Based on Cinema4D, Cinebench is a purpose built benchmark machine that renders a scene with both single and multi-threaded options. The scene is identical in both cases. The R20 version means that it targets Cinema 4D R20, a slightly older version of the software which is currently on version R21. Cinebench R20 was launched given that the R15 version had been out a long time, and despite the difference between the benchmark and the latest version of the software on which it is based, Cinebench results are often quoted a lot in marketing materials.
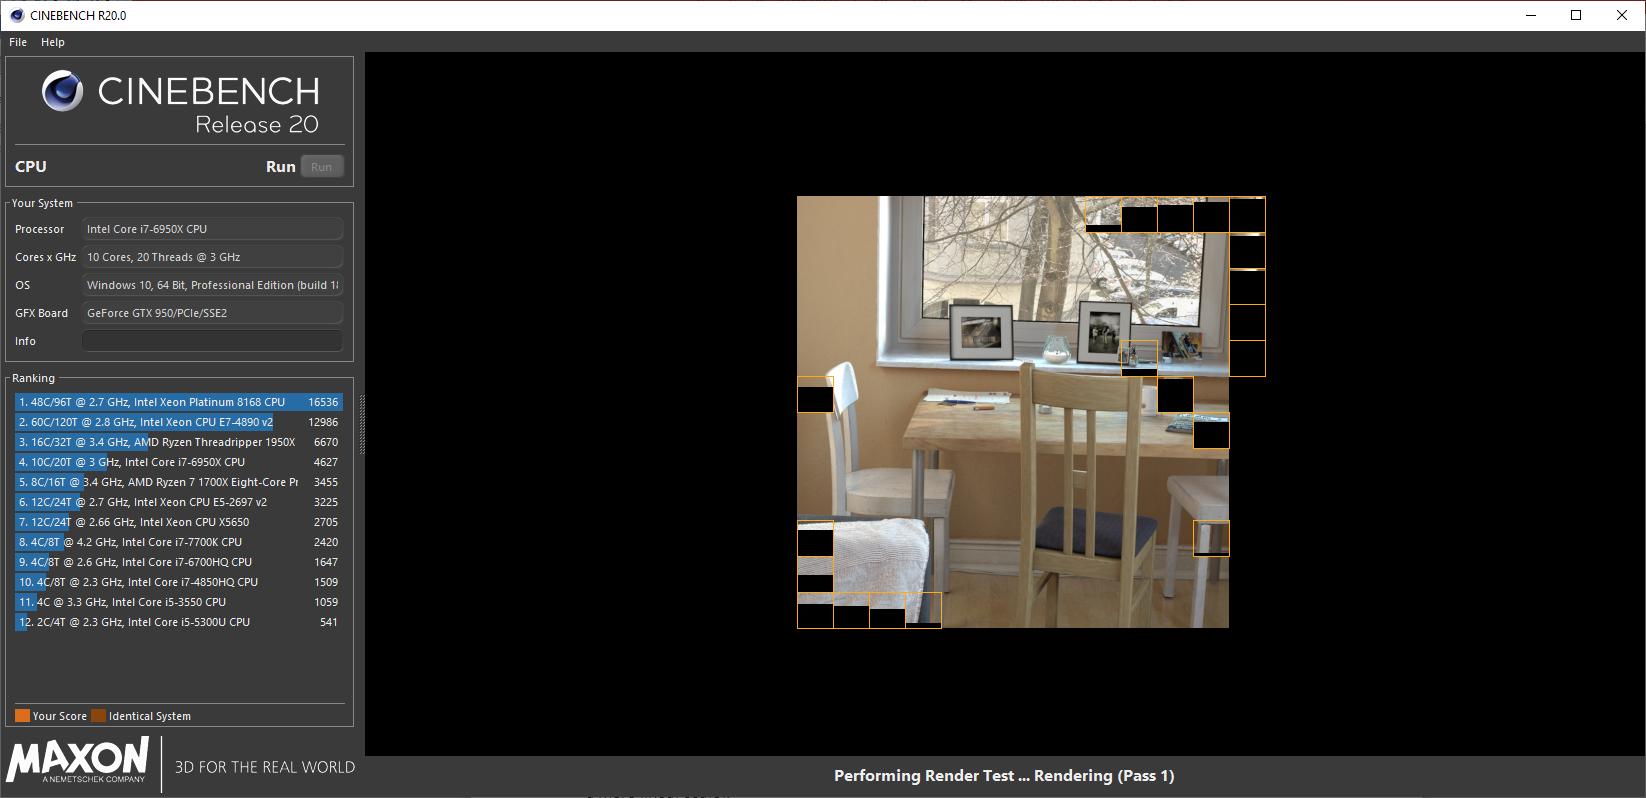
Results for Cinebench R20 are not comparable to R15 or older, because both the scene being used is different, but also the updates in the code bath. The results are output as a score from the software, which is directly proportional to the time taken. Using the benchmark flags for single CPU and multi-CPU workloads, we run the software from the command line which opens the test, runs it, and dumps the result into the console which is redirected to a text file. The test is repeated for a minimum of 10 minutes for both ST and MT, and then the runs averaged.
We are still in the process of rolling out CineBench R23 (you can see the results in our benchmark database here), but had not tested it on all the CPUs in this review at this time. It will be added to future reviews.


210 Comments
View All Comments
HarkPtooie - Saturday, January 30, 2021 - link
Noteworthy points:It is an i7-10700F
On a Gigabyte B460M
Populated with 4x16 GB DDR-3000
With an ancient Quadro K2000 and an NVMe SSD.
Hyperthreading is disabled.
I use it for running FEA simulations aside my Ryzen workstation, and it performs like a champ. The cheap&old wattmeter hoovers around 157 W or so during simulations. 100% CPU load.
So I take it that if I got the Z490, the CPU would draw 60W more. Would it go faster?
Qasar - Saturday, January 30, 2021 - link
as Spunjji said Harkptooie, practically every review out there, says the opposite of what you are.so, who is correct then ?
HarkPtooie - Sunday, January 31, 2021 - link
Oh, they do? Be a sport and link me to all those reviews.TechPowerUp puts it at 2W above the 3700X at stress test.
https://www.techpowerup.com/review/intel-core-i7-1...
Annnnd... that's it. The rest I find are all "compare" sites listing numbers culled from manufacturer sites.
And here comes Anandtech and tells me that my eyes are deceiving me and that my CPU is actually pulling twice as much as I am observing.
The explanation of which would be that better mobos have a power setting that allows it to draw much more than default, with no obvious benefits? I don't get it.
Everett F Sargent - Sunday, January 31, 2021 - link
Well, now you are almost there. Wherever there is. that is.Watts (power) * Time (seconds) = Energy (e. g. kWh) used
Power (W) versus frequency (Hz) is highly nonlinear (concave up and more so the closer you get to the redline). Your cooling solution can only dissipate so much power per unit time in 247 continuous operation, at a low enough core temperature.
This is all really basic stuff.
So, it will take longer to complete a fixed task at 125W then that same fixed task at 250W (all other things being equal), wherein the first task is running at 4GHz and the 2nd task is running at 5Ghz. These are only example numbers btw.
That TechPowerUp review has plenty of fixed task benchmarks (on the other pages) wherein the total time (in seconds) is given. You might want to check out those pages also.
They use four settings on a Z490 MB. The one that is closest to the out-of-box MB tests mentioned here is their "The third data point (blue bar) sees us relaxing the power limits to enable the maximum turbo frequency available for this processor." or what those bar charts are labeled as "Core i7-10700 Max Turbo" ...
It is a real shame that more sites don't do thorough enough reviews. So, for example, on this review on the 2nd page ...
https://images.anandtech.com/doci/16343/10700KInte...
That is a fixed time test and not a fixed task test. That should have been explained in this review.
Maybe this site will do better next time, by using a low end out-of-the-box MB in addition to their high end out-of-the-box Z490 MB. Report frequency, power, energy and time for all tests/tasks. Use proper recording of all these to get a more complete picture of what the heck is going on (time series and integrals thereof even).
My formal and informal (or on the job) training in doing scientific experiments goes back almost fifty years now. Not that that means anything on the internet. :/
Qasar - Sunday, January 31, 2021 - link
HarkPtooie toms hardware, gamers nexus, redgamingtech, moores law is dead. all pretty much say intel uses more power then amd. in some cases, quite a bit more.so either you have your system set up differently, and are forcing it to use the power it does, and the rest, let the board run as it see's fit, as you said : The explanation of which would be that better mobos have a power setting that allows it to draw much more than default, with no obvious benefits? I don't get it. " actually there is a benefit, when intel's cpus are allowed to use as much power as it can and wants, the performance goes up.
but what ever, you believe what you want.
HarkPtooie - Monday, February 1, 2021 - link
Yes, they do - but they do not say that the i7-10700 non-K uses twice the power of an equivalent Ryzen. That is exclusive to this article, and the explanation is that here they use "boost max all the time" BIOS settings that are not quite the nominal default for this CPU.This is overclocking.
Personally I turn it around and think "I am impressed at the performance Intel managed to squeeze out of this CPU at this power level, considering the process node disadvantage".
I am no fanboy. I usually buy AMD because bang/buck. This time I needed AVX-2 without having to tinker with experimental settings, which is the case with AMD+ANSYS.
HarkPtooie - Monday, February 1, 2021 - link
Ah - so the thing is that my CPU runs default as Intel intended it out of the box, whereas this review uses special motherboard settings that overdrives into a "use any power you need" zone where the max turbo runs all the time?Okay. That would explain things.
That Intel uses more power than AMD is not surprising since there is a substantial difference between 10 nm and 7 nm. And I am well aware that they cheat the numbers to look better - but that does not change the fact that nominally my 10700 draws about as much as my 3700X - and performs more or less equally. A bit faster single-thread, a bit slower multi-thread.
What this review amounts to is "If you reach inside your system and boost the shit out of your i7, it draws much more power than Ryzen." - why not go all the way and overclock them to 6 GHz and shriek about how the Intel draws 800W while the AMD only needs 600W?
Everett F Sargent - Monday, January 25, 2021 - link
What MB are you using and/or can you set PL!/PL2 in your BIOS settings? The article is suggesting that on higher end MB's, or some such, the PL1/PL2 settings are set to infinity or can be changed in the BIOS settings (even on a non-K CPU). PL1 is 125W so it appears that your MB has that limit.Everett F Sargent - Monday, January 25, 2021 - link
OK, made a mistake, the i7-10700 has a PL1 value of 65W and a PL2 of 224W and a PL1 Tau of 28s (those appear to be nominal or default values). Still curious as to the MB and accessible BIOS settings. Also is there any system software to see these settings (e. g. like AIDA64). TIAHarkPtooie - Tuesday, January 26, 2021 - link
I did not set any PL. The systems are default except for the RAM speed with is set by XMP to 3000 and 3200 MHz respectively.Should I interpret it as "during certain settings, the i7 can be made to consume vastly more power than it does by default"? That seems contrived.
All I know is that their power consumptions as measured for the whole system are roughly on par during conditions where incidentally the i7 also outperforms the Ryzen in single-thread applications. It is not a bad CPU.