Intel Core i7-10700 vs Core i7-10700K Review: Is 65W Comet Lake an Option?
by Dr. Ian Cutress on January 21, 2021 10:30 AM EST- Posted in
- CPUs
- Intel
- Core i7
- Z490
- 10th Gen Core
- Comet Lake
- i7-10700K
- i7-10700
CPU Tests: Synthetic and SPEC
Most of the people in our industry have a love/hate relationship when it comes to synthetic tests. On the one hand, they’re often good for quick summaries of performance and are easy to use, but most of the time the tests aren’t related to any real software. Synthetic tests are often very good at burrowing down to a specific set of instructions and maximizing the performance out of those. Due to requests from a number of our readers, we have the following synthetic tests.
Linux OpenSSL Speed: SHA256
One of our readers reached out in early 2020 and stated that he was interested in looking at OpenSSL hashing rates in Linux. Luckily OpenSSL in Linux has a function called ‘speed’ that allows the user to determine how fast the system is for any given hashing algorithm, as well as signing and verifying messages.
OpenSSL offers a lot of algorithms to choose from, and based on a quick Twitter poll, we narrowed it down to the following:
- rsa2048 sign and rsa2048 verify
- sha256 at 8K block size
- md5 at 8K block size
For each of these tests, we run them in single thread and multithreaded mode. All the graphs are in our benchmark database, Bench, and we use the sha256 results in published reviews.
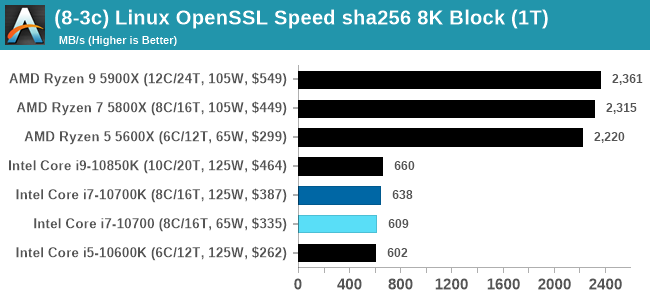
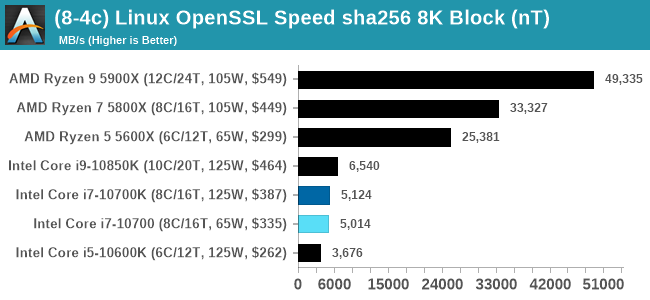
Specifically on the sha256 tests, both AMD and Via pull out a lead due to a dedicated sha256 compute block in each core. Intel is enabling accelerated sha256 via AVX-512 to its processors at a later date.
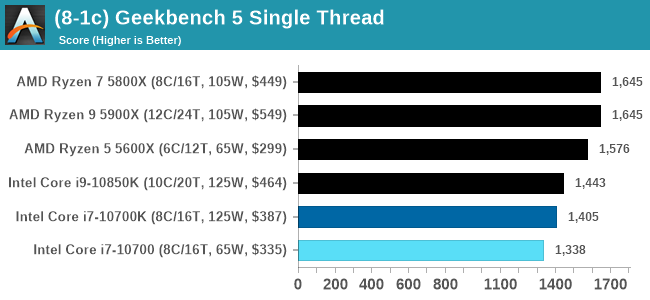
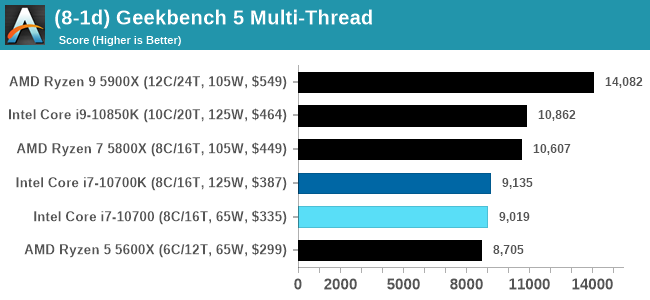
GeekBench 5: Link
As a common tool for cross-platform testing between mobile, PC, and Mac, GeekBench is an ultimate exercise in synthetic testing across a range of algorithms looking for peak throughput. Tests include encryption, compression, fast Fourier transform, memory operations, n-body physics, matrix operations, histogram manipulation, and HTML parsing.
I’m including this test due to popular demand, although the results do come across as overly synthetic, and a lot of users often put a lot of weight behind the test due to the fact that it is compiled across different platforms (although with different compilers).
We have both GB5 and GB4 results in our benchmark database. GB5 was introduced to our test suite after already having tested ~25 CPUs, and so the results are a little sporadic by comparison. These spots will be filled in when we retest any of the CPUs.
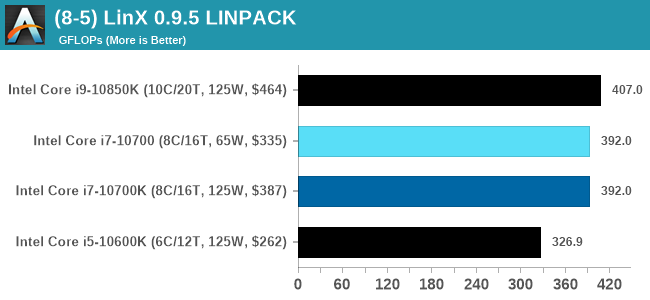
LinX 0.9.5 LINPACK
One of the benchmarks I’ve been after for a while is just something that outputs a very simple GFLOPs FP64 number, or in the case of AI I’d like to get a value for TOPs at a given level of quantization (FP32/FP16/INT8 etc). The most popular tool for doing this on supercomputers is a form of LINPACK, however for consumer systems it’s a case of making sure that the software is optimized for each CPU.
LinX has been a popular interface for LINPACK on Windows for a number of years. However the last official version was 0.6.5, launched in 2015, before the latest Ryzen hardware came into being. HWTips in Korea has been updating LinX and has separated out into two versions, one for Intel and one for AMD, and both have reached version 0.9.5. Unfortunately the AMD version is still a work in progress, as it doesn’t work on Zen 2.
There does exist a program called Linpack Extreme 1.1.3, which claims to be updated to use the latest version of the Intel Math Kernel Libraries. It works great, however the way the interface has been designed means that it can’t be automated for our uses, so we can’t use it.
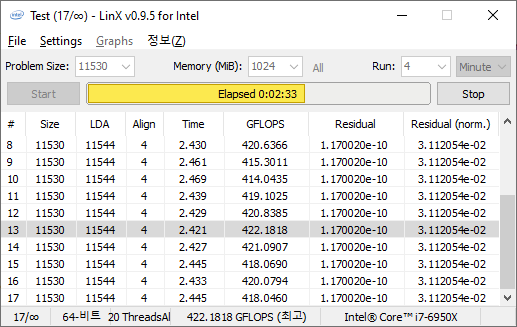
For LinX 0.9.5, there also is a difficulty of what parameters to put into LINPACK. The two main parameters are problem size and time – choose a problem size too small, and you won’t get peak performance. Choose it too large, and the calculation can go on for hours. To that end, we use the following algorithms as a compromise:
- Memory Use = Floor(1000 + 20*sqrt(threads)) MB
- Time = Floor(10+sqrt(threads)) minutes
For a 4 thread system, we use 1040 MB and run for 12 minutes.
For a 128 thread system, we use 1226 MB and run for 21 minutes.
CPU Tests: SPEC
SPEC2017 and SPEC2006 is a series of standardized tests used to probe the overall performance between different systems, different architectures, different microarchitectures, and setups. The code has to be compiled, and then the results can be submitted to an online database for comparison. It covers a range of integer and floating point workloads, and can be very optimized for each CPU, so it is important to check how the benchmarks are being compiled and run.
We run the tests in a harness built through Windows Subsystem for Linux, developed by our own Andrei Frumusanu. WSL has some odd quirks, with one test not running due to a WSL fixed stack size, but for like-for-like testing is good enough. SPEC2006 is deprecated in favor of 2017, but remains an interesting comparison point in our data. Because our scores aren’t official submissions, as per SPEC guidelines we have to declare them as internal estimates from our part.
For compilers, we use LLVM both for C/C++ and Fortan tests, and for Fortran we’re using the Flang compiler. The rationale of using LLVM over GCC is better cross-platform comparisons to platforms that have only have LLVM support and future articles where we’ll investigate this aspect more. We’re not considering closed-sourced compilers such as MSVC or ICC.
clang version 10.0.0
clang version 7.0.1 (ssh://git@github.com/flang-compiler/flang-driver.git
24bd54da5c41af04838bbe7b68f830840d47fc03)
-Ofast -fomit-frame-pointer
-march=x86-64
-mtune=core-avx2
-mfma -mavx -mavx2
Our compiler flags are straightforward, with basic –Ofast and relevant ISA switches to allow for AVX2 instructions. We decided to build our SPEC binaries on AVX2, which puts a limit on Haswell as how old we can go before the testing will fall over. This also means we don’t have AVX512 binaries, primarily because in order to get the best performance, the AVX-512 intrinsic should be packed by a proper expert, as with our AVX-512 benchmark. All of the major vendors, AMD, Intel, and Arm, all support the way in which we are testing SPEC.
To note, the requirements for the SPEC licence state that any benchmark results from SPEC have to be labelled ‘estimated’ until they are verified on the SPEC website as a meaningful representation of the expected performance. This is most often done by the big companies and OEMs to showcase performance to customers, however is quite over the top for what we do as reviewers.
For each of the SPEC targets we are doing, SPEC2006 rate-1, SPEC2017 speed-1, and SPEC2017 speed-N, rather than publish all the separate test data in our reviews, we are going to condense it down into a few interesting data points. The full per-test values are in our benchmark database.
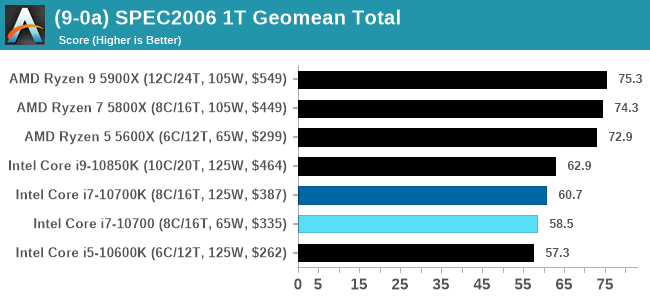
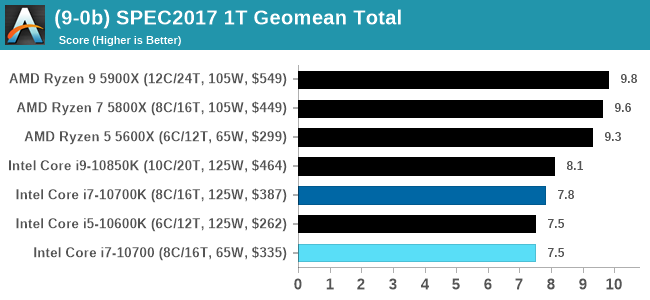
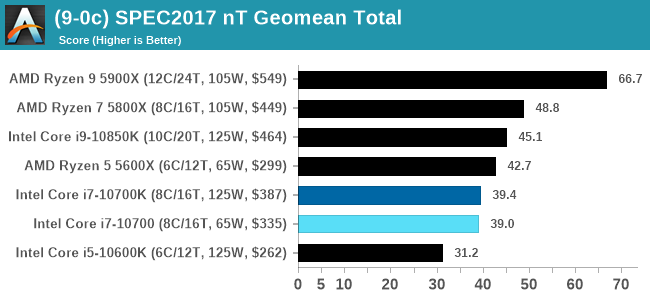
Both of the 8-core Core i7 parts here are handily beaten by AMD's 6-core Ryzen 5 in ST and MT.


210 Comments
View All Comments
HarkPtooie - Saturday, January 30, 2021 - link
Noteworthy points:It is an i7-10700F
On a Gigabyte B460M
Populated with 4x16 GB DDR-3000
With an ancient Quadro K2000 and an NVMe SSD.
Hyperthreading is disabled.
I use it for running FEA simulations aside my Ryzen workstation, and it performs like a champ. The cheap&old wattmeter hoovers around 157 W or so during simulations. 100% CPU load.
So I take it that if I got the Z490, the CPU would draw 60W more. Would it go faster?
Qasar - Saturday, January 30, 2021 - link
as Spunjji said Harkptooie, practically every review out there, says the opposite of what you are.so, who is correct then ?
HarkPtooie - Sunday, January 31, 2021 - link
Oh, they do? Be a sport and link me to all those reviews.TechPowerUp puts it at 2W above the 3700X at stress test.
https://www.techpowerup.com/review/intel-core-i7-1...
Annnnd... that's it. The rest I find are all "compare" sites listing numbers culled from manufacturer sites.
And here comes Anandtech and tells me that my eyes are deceiving me and that my CPU is actually pulling twice as much as I am observing.
The explanation of which would be that better mobos have a power setting that allows it to draw much more than default, with no obvious benefits? I don't get it.
Everett F Sargent - Sunday, January 31, 2021 - link
Well, now you are almost there. Wherever there is. that is.Watts (power) * Time (seconds) = Energy (e. g. kWh) used
Power (W) versus frequency (Hz) is highly nonlinear (concave up and more so the closer you get to the redline). Your cooling solution can only dissipate so much power per unit time in 247 continuous operation, at a low enough core temperature.
This is all really basic stuff.
So, it will take longer to complete a fixed task at 125W then that same fixed task at 250W (all other things being equal), wherein the first task is running at 4GHz and the 2nd task is running at 5Ghz. These are only example numbers btw.
That TechPowerUp review has plenty of fixed task benchmarks (on the other pages) wherein the total time (in seconds) is given. You might want to check out those pages also.
They use four settings on a Z490 MB. The one that is closest to the out-of-box MB tests mentioned here is their "The third data point (blue bar) sees us relaxing the power limits to enable the maximum turbo frequency available for this processor." or what those bar charts are labeled as "Core i7-10700 Max Turbo" ...
It is a real shame that more sites don't do thorough enough reviews. So, for example, on this review on the 2nd page ...
https://images.anandtech.com/doci/16343/10700KInte...
That is a fixed time test and not a fixed task test. That should have been explained in this review.
Maybe this site will do better next time, by using a low end out-of-the-box MB in addition to their high end out-of-the-box Z490 MB. Report frequency, power, energy and time for all tests/tasks. Use proper recording of all these to get a more complete picture of what the heck is going on (time series and integrals thereof even).
My formal and informal (or on the job) training in doing scientific experiments goes back almost fifty years now. Not that that means anything on the internet. :/
Qasar - Sunday, January 31, 2021 - link
HarkPtooie toms hardware, gamers nexus, redgamingtech, moores law is dead. all pretty much say intel uses more power then amd. in some cases, quite a bit more.so either you have your system set up differently, and are forcing it to use the power it does, and the rest, let the board run as it see's fit, as you said : The explanation of which would be that better mobos have a power setting that allows it to draw much more than default, with no obvious benefits? I don't get it. " actually there is a benefit, when intel's cpus are allowed to use as much power as it can and wants, the performance goes up.
but what ever, you believe what you want.
HarkPtooie - Monday, February 1, 2021 - link
Yes, they do - but they do not say that the i7-10700 non-K uses twice the power of an equivalent Ryzen. That is exclusive to this article, and the explanation is that here they use "boost max all the time" BIOS settings that are not quite the nominal default for this CPU.This is overclocking.
Personally I turn it around and think "I am impressed at the performance Intel managed to squeeze out of this CPU at this power level, considering the process node disadvantage".
I am no fanboy. I usually buy AMD because bang/buck. This time I needed AVX-2 without having to tinker with experimental settings, which is the case with AMD+ANSYS.
HarkPtooie - Monday, February 1, 2021 - link
Ah - so the thing is that my CPU runs default as Intel intended it out of the box, whereas this review uses special motherboard settings that overdrives into a "use any power you need" zone where the max turbo runs all the time?Okay. That would explain things.
That Intel uses more power than AMD is not surprising since there is a substantial difference between 10 nm and 7 nm. And I am well aware that they cheat the numbers to look better - but that does not change the fact that nominally my 10700 draws about as much as my 3700X - and performs more or less equally. A bit faster single-thread, a bit slower multi-thread.
What this review amounts to is "If you reach inside your system and boost the shit out of your i7, it draws much more power than Ryzen." - why not go all the way and overclock them to 6 GHz and shriek about how the Intel draws 800W while the AMD only needs 600W?
Everett F Sargent - Monday, January 25, 2021 - link
What MB are you using and/or can you set PL!/PL2 in your BIOS settings? The article is suggesting that on higher end MB's, or some such, the PL1/PL2 settings are set to infinity or can be changed in the BIOS settings (even on a non-K CPU). PL1 is 125W so it appears that your MB has that limit.Everett F Sargent - Monday, January 25, 2021 - link
OK, made a mistake, the i7-10700 has a PL1 value of 65W and a PL2 of 224W and a PL1 Tau of 28s (those appear to be nominal or default values). Still curious as to the MB and accessible BIOS settings. Also is there any system software to see these settings (e. g. like AIDA64). TIAHarkPtooie - Tuesday, January 26, 2021 - link
I did not set any PL. The systems are default except for the RAM speed with is set by XMP to 3000 and 3200 MHz respectively.Should I interpret it as "during certain settings, the i7 can be made to consume vastly more power than it does by default"? That seems contrived.
All I know is that their power consumptions as measured for the whole system are roughly on par during conditions where incidentally the i7 also outperforms the Ryzen in single-thread applications. It is not a bad CPU.