Understanding Brightness in AMOLED and LCD Displays
by Joshua Ho & Brandon Chester on December 22, 2014 8:00 AM EST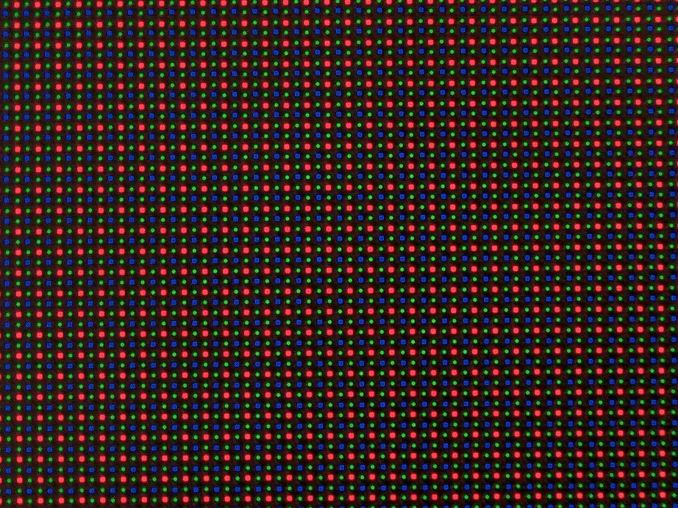
While we generally avoid going into deep detail when it comes to our display testing, in light of statements that seemingly contradict our testing it becomes important to contextualize our display tests. Many people are often confused by contradicting statements regarding the peak brightness of an AMOLED display, as we will state that the Samsung Galaxy Note 4’s display reaches a maximum of 462 cd/m^2, while other sites often state that the Note 4’s display reaches a maximum of 750 cd/m^2. Another commonly cited discrepancy is that we rate the Nexus 6’s display to reach a peak brightness of 258 nits, while others have rated the Nexus 6’s display to be as bright as 400 nits.
One might immediately assume that one measurement is right, and the other is false. In truth, both measurements are achievable, as we’ll soon see. Before we get into any discussion of testing methodology though, we must first understand how AMOLED and LCD displays work. Fundamentally, LCD and OLED displays are almost completely different from one another, but face similar issues and limitations. LCD is the older of the two technologies, and is fundamentally quite simple, although not quite as simple as OLED. In short, we can view an LCD display as made of a backlight, and a color filtering array which has liquid crystals that control the passage of light, along with polarizers to make sure that the filtering system works correctly.

To break this system down further, we can look at the backlight. In the case of mobile devices, the only acceptable backlight system for thickness and power efficiency reasons is the edge-lit LED, which places a line of LEDs along an edge of the display, which is then diffused through a sheet of transparent material with strategically-placed bumps in the material to create points of light via total internal reflection. For the most part, LEDs in use today are blue LEDs with yellow phosphors in order to increase efficiency, although this means that the natural white point of such a backlight is higher than 6504k and requires filtering in order to reach a calibrated white point.

Schematic diagram IPS LC display / BBCLCD
While the backlight is relatively simple, the actual color filtering is a bit more complicated, although we will avoid extensive depth in this case. In the case of IPS, the structure is generally quite simple in nature, with two electrodes in plane with each other, which is used to generate an electric field that rotates the orientation of the liquid crystals in plane with the display to dynamically alter the polarization of the light that can pass through the liquid crystal array. With a set of fixed polarizers before and after the liquid crystal array, by using the controlling TFTs to alter the voltage applied on the electrodes one can adjust individual color output on a per-pixel basis.

AMOLED is a fundamentally different approach to the problem, which uses organic emitters deposited upon a substrate. These emitters are designed to emit red, green, or blue when voltage is applied across two electrodes. Similarly, TFTs are needed to control each pixel. As one can see, AMOLED is a simpler solution, but in practice the issues with such an implementation can be quite complex.
In order to determine what picture content to use for a measurement of maximum brightness, we must turn to a measurement known as Average Picture Level (APL). This is best explained as the percentage of the display that is lit up compared to a full white display, so a display that is completely red, green, or blue would be 33% APL.
As one might already be able to guess, with AMOLED power consumption is highly dependent upon the content displayed. With a pure white image, every pixel must be lit, while with a pure black image every pixel is off. As the display typically has a maximum power use set for a mobile device, this opens up the capability for AMOLED displays to allocate more power per pixel (i.e. higher maximum luminance) when not displaying a full-white image. This is in contrast with the edge-lit LCDs used in mobile displays, which have relatively limited local-dimming capabilities. As a result, the maximum brightness of an LCD is relatively fixed, regardless of the displayed content.
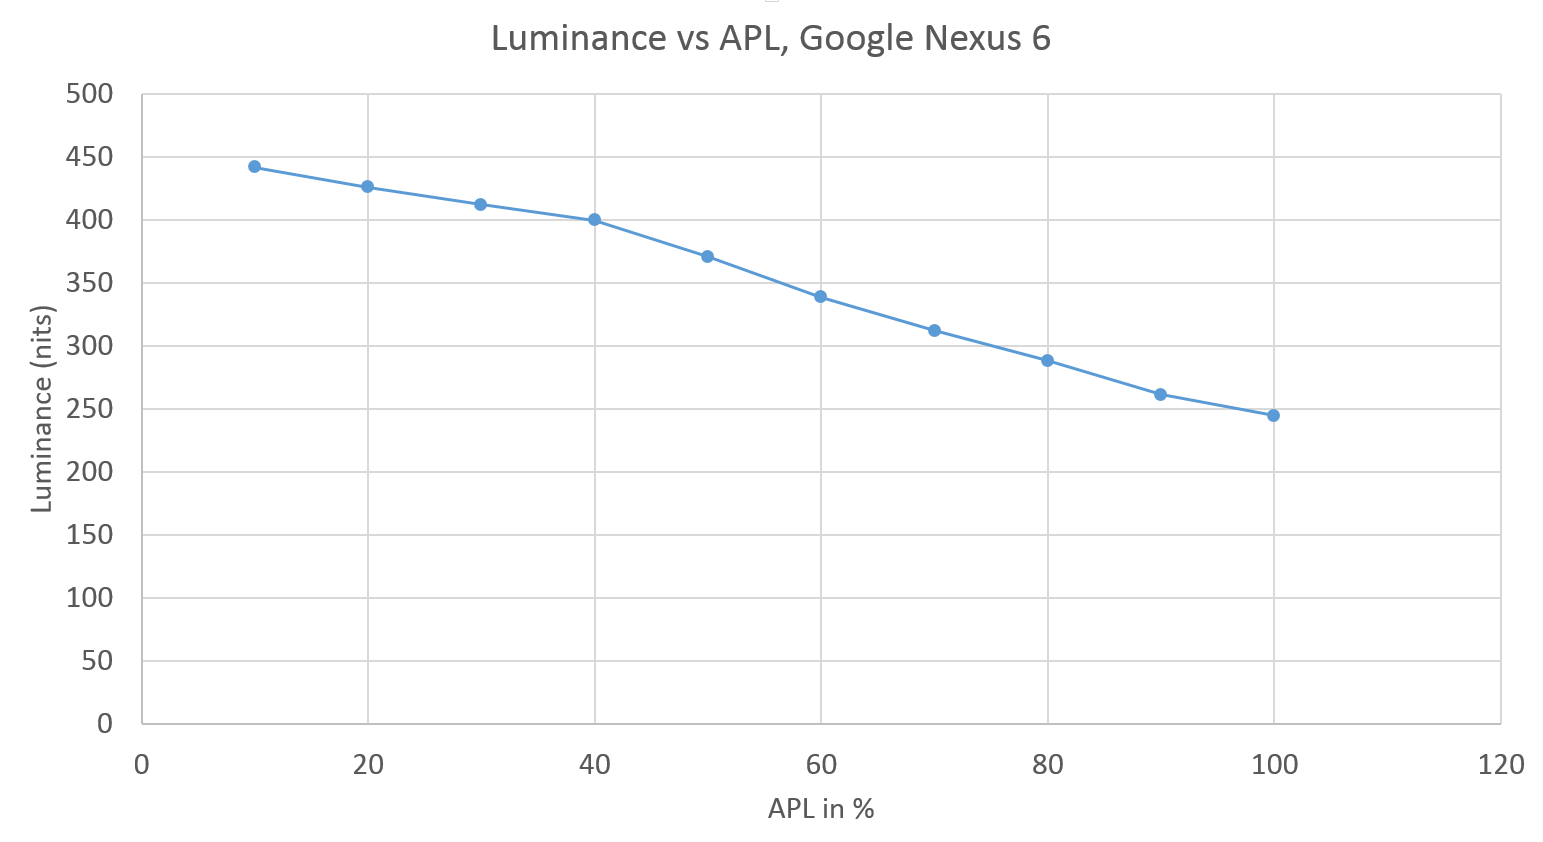
In the case of the Nexus 6, we can clearly see dimishing returns after 40% APL as there is efficiency droop on AMOLED displays that are similar in nature to LED backlights. While now it’s easy to understand why it is that AMOLED can vary in maximum brightness, the question is which brightness is “correct”. While an AMOLED display can technically have a maximum brightness of 750 nits, it’s unlikely that people will look at images effectively equivalent to 1% of the display lit up with white.
In practice, it turns out that with Lollipop and almost all web pages, the average picture level is quite high. It’s increasingly rare to see cases where displayed content is below 50% APL. According to Motorola, 80% APL represents an average APL for light UIs and in light of this, it seems appropriate to test at similarly real-world APLs. Taking a look at some commonly used applications in Lollipop, we see that the APL is regularly at or above even Motorola's 80% figure. I opened some of the applications on my Nexus 6's homescreen to take screenshots of whatever they had open when they came up, and I've tabulated the results below.
| APL in % | |
| Messenger | 86 |
| Calculator | 49 |
| Settings | 84 |
| Calendar | 80 |
| Phone | 89 |
| Reddit Is Fun (Light) | 77 |
| Reddit Is Fun (Dark) | 23 |
| Chrome New Tab | 86 |
| Wikipedia | 83 |
| AnandTech | 52 |
| AnandTech Article | 81 |
| 76 |


As you can see, many of the screens in Android's interface as well as web pages and third party apps have a high APL. There are exceptions, like the Calculator application and any application with a dark theme, but the overall trend is clear. Google's new interface style also means that applications are more likely to adopt interfaces with large amounts of white than in the past.
As a result of this, we test at 100% APL in order to get an idea of perceived brightness. While there may be some need for lower APL testing, it’s important to also consider cases such as OLED aging which will lower peak brightness over time. It's also important to consider that the delta between 80% APL and 100% APL in this case is around 44 nits. This makes for about an 18% delta in brightness, which ends up being around the noticeable difference in most cases. While our testing is subject to change, in the case of brightness we currently do not see much need to dramatically alter our methodology.


85 Comments
View All Comments
Magictoaster - Monday, December 22, 2014 - link
I too see this as a bit confusing. I understand the basic concept that driving few pixels allows them to drive the remaining pixels to a higher output.Where I'm confused is that brightness is being measured in cd/m^2. As others have noted, if part of the screen is not illuminated, you would imagine the brightness would go down when you average in the non-illuminated area. The only way I see this not happening is if your measuring device is measuring a sample spot on the screen (say 25pix x 25 pix) and basing the calculation on that sample. This calculation would seem inaccurate to me. I would say a better calculation is to measure the total cd emitted from the screen and dived by area to get cd/m2
To me it would seem that measuring the screen at full white (100%APL) would make more sense now, because you do not need to try to average in the dark areas. Its also easier to compare to an LCD which would achieve max brightness when all white.
I think the article is a good start, but could be fleshed out more. I also agree with users who state that instead of arguing over which APL to measure at, just present the chart from 0-100%, so users have all the information needed. If that is too time consuming, then I think showing the 100% APL figure makes more sense to me.
Magictoaster - Monday, December 22, 2014 - link
some one explained this later in the comments. The APL is measuring luminescence per pixel in nits not per area. This clarifies things for me now.I still vote for a full APL graph in test data!
krutou - Monday, December 22, 2014 - link
Reading between the lines, for the AMOLED/APL analysis, brightness is measured as brightness density (e.g. nits/pixel), not total brightness.Death666Angel - Monday, December 22, 2014 - link
"LCD display"No. :D
Pissedoffyouth - Monday, December 22, 2014 - link
Great article. I love Anandtech because of this type of reporting, it's easy to read.Quick question, could you perhaps do an article on so called "burn in" and see if it actually happens on AMOLED or if it's a myth. Thanks
Old_Fogie_Late_Bloomer - Monday, December 22, 2014 - link
I can save them the trouble. On my Galaxy Note II, there's unmistakable evidence of screen burn-in; namely, a plainly visible bright strip at the top of the display where the dark gray status bar is displayed in portrait mode.grahaman27 - Monday, December 22, 2014 - link
burn-in is certainly not a myth.FunBunny2 - Monday, December 22, 2014 - link
Welcome back, CRT!!!Wolfpup - Tuesday, December 23, 2014 - link
Yeah...this is one of the reasons I'm just not really buying in to OLED. From my real world use of both OLED and LCD, good LCD IMO looks better and (ironically) handles dark scenes better, AND it doesn't have all these obnoxious limitations that CRT and other technologies had. I'd need a really, REALLY good reason to have to go back to worrying about burn in and the like.Weirdly my new HP monitor (which I bought only because I needed built in speakers in this location) claims it can suffer from burn in...
Siana - Wednesday, January 28, 2015 - link
CRT Burn-In eventually became pretty much a myth though. It was nearly impossible to burn in a CRT within 8 or so years of use by the late 90ies.After 8 years of office type use, the backlight of an LCD monitor with CCFL is absolutely useless, it's faded to half its nominal brightness and the colours have shifted.
New LCD monitors no longer use CCFL, obsoleted by solid-state LED. It remains to be seen how well they fare with time, the estimates lie between 3 and 30 years of useful life.
For OLED burn in to set in, we're talking months, not years though!