Original Link: https://www.anandtech.com/show/6726/3dmark-for-windows-launches-we-test-it-with-various-laptops
3DMark for Windows Launches; We Test It with Various Laptops
by Jarred Walton on February 5, 2013 5:00 AM EST3DMark for Windows Overview
After a two-year hiatus, Futuremark is back with a new version of 3DMark, and in many ways this is their most ambitious version to date. Instead of the usual PC graphics benchmark, with this release, dubbed simply “3DMark” (there’s no year or other designation this time), Futuremark is creating a cross-platform benchmark—Windows, Windows RT, iOS, and Android will all be capable of running the same graphics benchmark, sort of. Today’s release is for Windows only, and this is the most feature-packed of the 3DMark releases with three separate graphics benchmarks.
Ice Storm is a DX9-level graphics benchmark (ed: specifically D3D11 FL 9_1), and this is what we’ll see on Android, iOS, and Windows RT. Cloud Gate is the second benchmark and it uses DX10-level effects and hardware, but it will only run on standard Windows; it’s intended to show the capabilities of Windows notebooks and home PCs. The third benchmark is Fire Strike, and this is the one that will unlock the full potential of DX11-level hardware; it’s intended to showcase the capabilities of modern gaming PCs. Fire Strike also has a separate Extreme setting to tax your system even more.
Each of the three benchmarks, at least on the Windows release, comes with four elements: two graphics tests, a physics test, and a demo mode (not used in the benchmark score) that comes complete with audio and a lengthier “story” to go with the scene. I have fond memories of running various demo scene files way back in the day, and I think the inclusion of A/V sequences for all three scenes is a nice addition. Another change with this release is that all resolutions are unlocked for all platforms; the testing will render internally to the specified resolution and will then scale the output to fit your particular display—no longer will we have to use an external display to test 1080p on a typical laptop, hallelujah! You can even run the Extreme preset for Fire Strike on a 1366x768 budget notebook if you like seeing things render at seconds per frame.
As has been the case with most releases, 3DMark comes in three different versions. The free Basic Edition includes all three tests and simply runs them at the default settings; there’s no option to tweak any of the settings, and the Fire Strike test does not include the Extreme preset. When you run the Basic Edition, your only option is to run all three tests (at least on Windows platforms), and the results are submitted to the online database for management. For $24.99, the Advanced Edition adds the Extreme Fire Strike preset, you can run at custom settings and resolutions, and you can individually benchmark the three tests. There are also options to loop the benchmarks and 3DMark has added a bunch of new graphs; you can also save the results offline for later viewing. Finally, the Professional Edition is intended for business and commercial use and costs $995. Besides all of the features in the Advanced Edition, it adds a command line utility, an image quality tool, private offline results option, and it can export the results to XML.
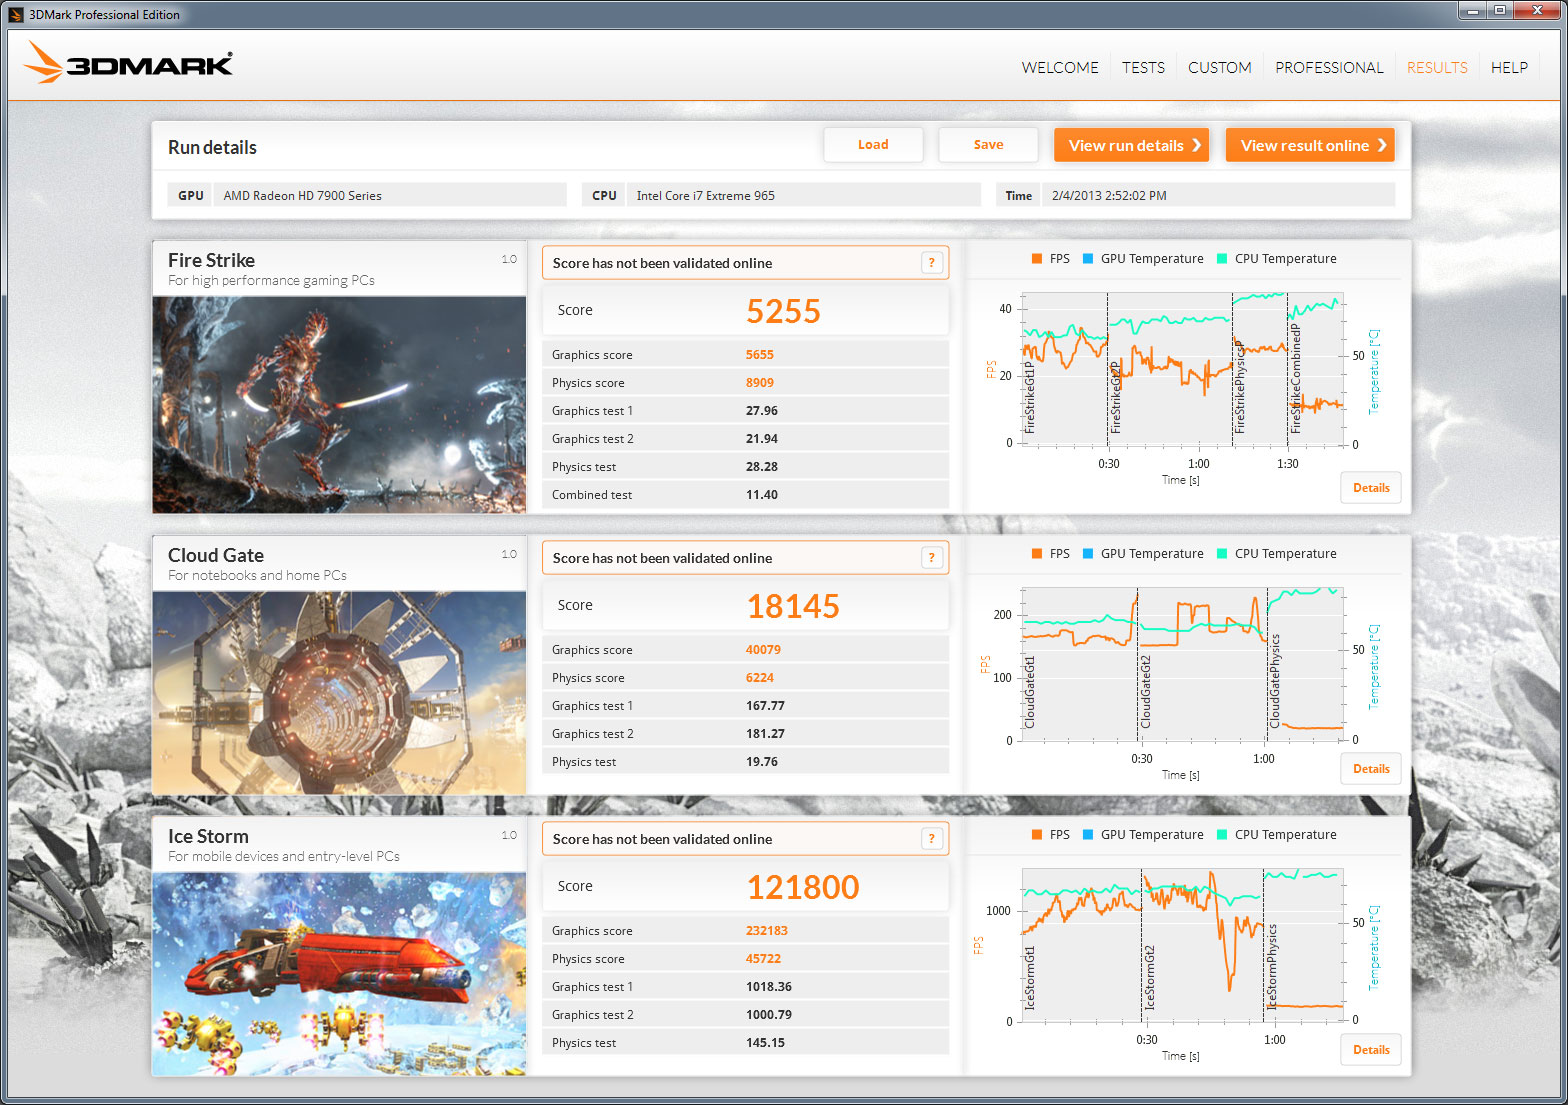
Before we get to some initial results, let’s take a look at one of the cool new features with the latest 3DMark: graphs. Above you can see the post-benchmark results from my personal gaming desktop with a slightly overclocked i7-965X and HD 7950, and along with the usual scores there are graphs for each test showing real-time frame rates and CPU and GPU temperatures. Something I’ve noticed is that the GPU temperatures don’t show up on quite a few of my test systems, and hopefully that will improve with future updates, but this is still a great new inclusion. Each graph also allows you to explore further details:
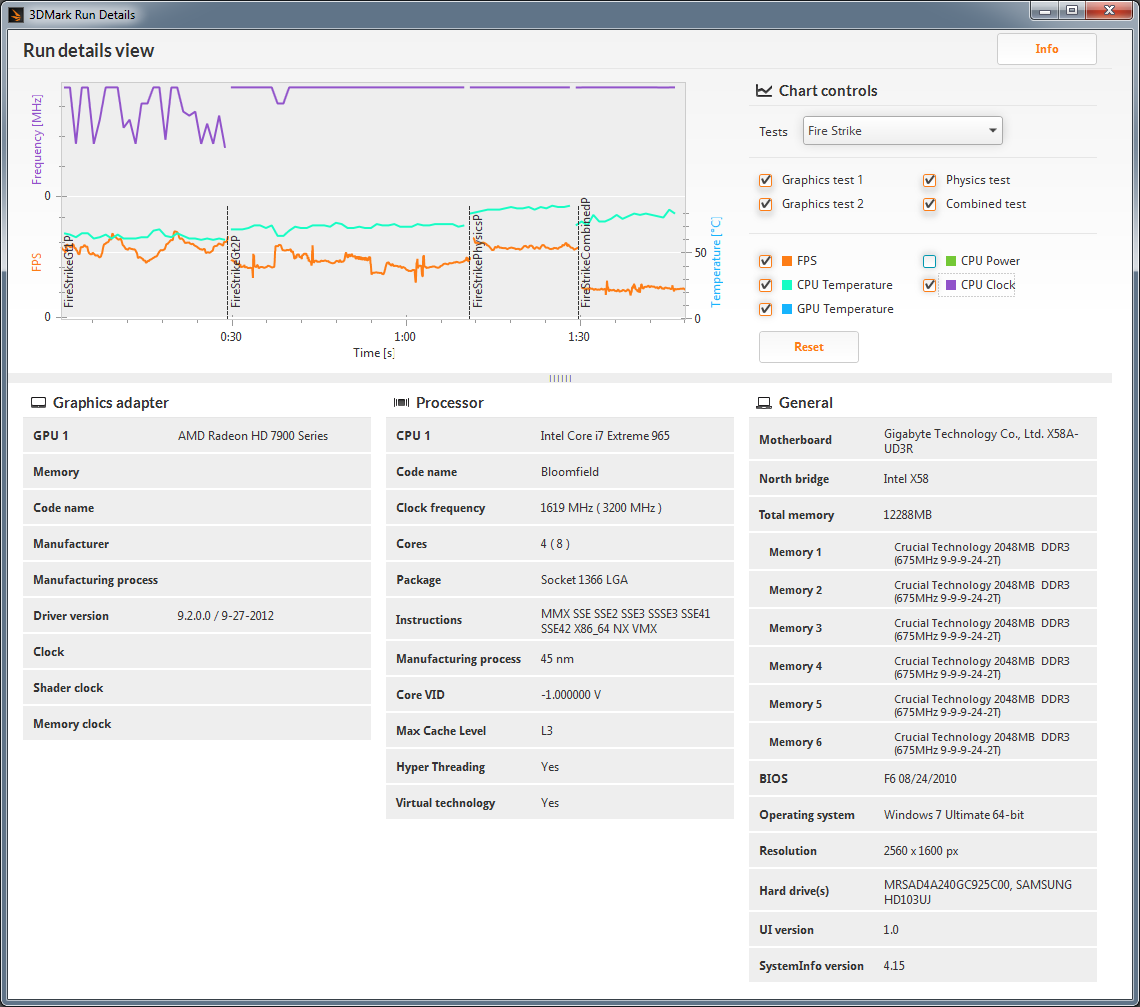
Along with the FPS and temperature graphs, the detailed view also adds the option for CPU clocks and CPU power (though again, power at least isn’t always available depending on the platform, e.g. it’s missing again on my Bloomfield desktop). Something you can’t see with the images is that you can also mouse over and select any of the points on the graphs to get additional details (e.g. frame rate at a specific point), and you can zoom in/out as well. It’s too bad that only paying customers (or press) will be able to get full access to the graphs, but for ORB and overclocking enthusiasts these new features definitely make the $25 cost look more palatable.
Along with the various updates, the UI for 3DMark has change quite a bit as well, presumably to make it more tablet-friendly. I’m not sure how it will work on tablets specifically, but what I can say is that there are certain options that are missing, and the new UI takes some getting used to. For example, even with the Professional Edition, there’s no easy way to run all the benchmarks without the demos. You can run the Ice Storm, Cloud Gate, and Fire Strike benchmarks individually, or you can do a custom run of any of those three, but what I want is an option to run all three tests with custom settings in one batch. This was possible on every previous 3DMark release, so hopefully we get an update to add this functionality (or at least give the Advanced and Professional versions a “run all without demo” on the Welcome screen). Besides that minor complaint, things are pretty much what we’re used to seeing, so let’s do some benchmarking.
Initial 3DMark Notebook Results
While we don’t normally run 3DMark for our CPU and GPU reviews, we do like to run the tests for our system and notebook reviews. The reason is simple: we don’t usually have long-term access to these systems, so in six months or a year when we update benchmarks we don’t have the option to go back and retest a bunch of hardware to provide current results. That’s not the case on desktop CPUs and GPUs, which explains the seeming discrepancy. 3DMark has been and will always be a synthetic graphics benchmark, which means the results are not representative of true gaming performance; instead, the results are a ballpark estimate of gaming potential, and as such they will correlate well with some titles and not so well with others. This is the reason we benchmark multiple games—not to mention mixing up our gaming suite means that driver teams have to do work for the games people actually play and not just the benchmarks.
The short story here (TL;DR) is that just as Batman: Arkham City, Elder Scrolls: Skyrim, and Far Cry 3 have differing requirements and performance characteristics, 3DMark results can’t tell you exactly how every game will run—the only thing that will tell you how game X truly scales across various platforms is of course to specifically benchmark game X. I’m also more than a little curious to see how performance will change over the coming months as 3DMark and the various GPU drivers are updated, so with version 1.00 and current drivers in hand I ran the benchmarks on a selection of laptops along with my own gaming desktop.
I tried to include the last two generations of hardware, with a variety of AMD, Intel, and NVIDIA hardware. Unfortunately, there's only so much I can do in a single day, and right now I don't have any high-end mobile NVIDIA GPUs available. Here’s the short rundown of what I tested:
| System Details for Initial 3DMark Results | |||
| System | CPU (Clocks) |
GPU (Core/RAM Clocks) |
RAM (Timings) |
| Gaming Desktop |
Intel Core i7-965X 4x3.64GHz (no Turbo) |
HD 7950 3GB 900/5000MHz |
6x2GB DDR2-800 675MHz@9-9-9-24-2T |
| Alienware M17x R4 |
Intel Core i7-3720QM 4x2.6-3.6GHz |
HD 7970M 2GB 850/4800MHz |
2GB+4GB DDR3-1600 800MHz@11-11-11-28-1T |
| AMD Llano |
AMD A8-3500M 4x1.5-2.4GHz |
HD 6620G 444MHz |
2x2GB DDR3-1333 673MHz@9-9-9-24 |
| AMD Trinity |
AMD A10-4600M 4x2.3-3.2GHz |
HD 7660G 686MHz |
2x2GB DDR3-1600 800MHz@11-11-12-28 |
| ASUS N56V |
Intel Core i7-3720QM 4x2.6-3.6GHz |
GT 630M 2GB 800/1800MHz HD 4000@1.25GHz |
2x4GB DDR3-1600 800MHz@11-11-11-28-1T |
| ASUS UX51VZ |
Intel Core i7-3612QM 4x2.1-3.1GHz |
GT 650M 2GB 745-835/4000MHz |
2x4GB DDR3-1600 800MHz@11-11-11-28-1T |
| Dell E6430s |
Intel Core i5-3360M 2x2.8-3.5GHz |
HD 4000@1.2GHz |
2GB+4GB DDR3-1600 800MHz@11-11-11-28-1T |
| Dell XPS 12 |
Intel Core i7-3517U 2x1.9-3.0GHz |
HD 4000@1.15GHz |
2x4GB DDR3-1333 667MHz@9-9-9-24-1T |
| MSI GX60 |
AMD A10-4600M 4x2.3-3.2GHz |
HD 7970M 2GB 850/4800MHz |
2x4GB DDR3-1600 800MHz@11-11-12-28 |
| Samsung NP355V4C |
AMD A10-4600M 4x2.3-3.2GHz |
HD 7670M 1GB 600/1800MHz HD 7660G 686MHz (Dual Graphics) |
2GB+4GB DDR3-1600 800MHz@11-11-11-28 |
| Sony VAIO C |
Intel Core i5-2410M 2x2.3-2.9GHz |
HD 3000@1.2GHz |
2x2GB DDR3-1333 666MHz@9-9-9-24-1T |
Just a quick note on the above laptops is that I did run several overlapping results (e.g. HD 4000 with dual-core, quad-core, and ULV; A10-4600M with several dGPU options), but I’ve taken the best result on items like the quad-core HD 4000 and Trinity iGPU. The Samsung laptop also deserves special mention as it supports AMD Dual Graphics with HD 7660G and 7670M; my last encounter with Dual Graphics was on the Llano prototype, and things didn’t go so well. 3DMark is so new that I wouldn’t expect optimal performance, but I figured I’d give it a shot. Obviously, some of the laptops in the above list haven’t received a complete review, and in most cases those reviews are in progress.
And with that out of the way, here are the results. I’ll start with the Ice Storm tests, followed by Cloud Gate and then Fire Strike.
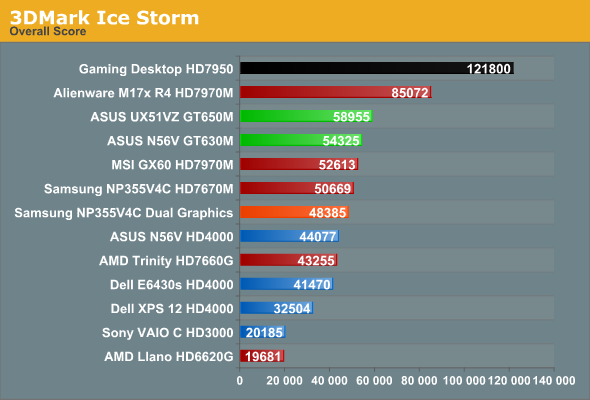
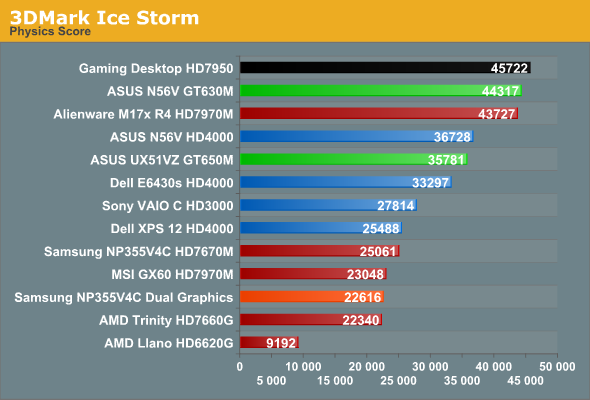
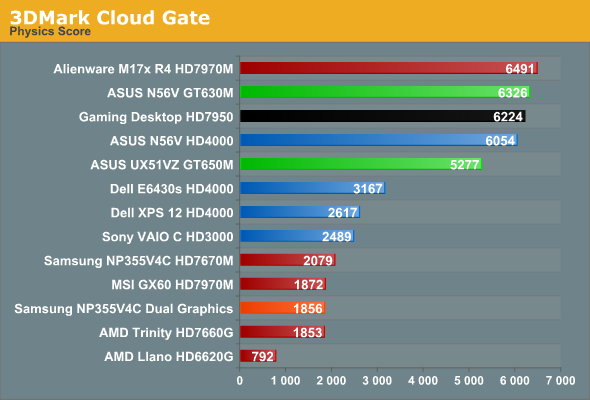
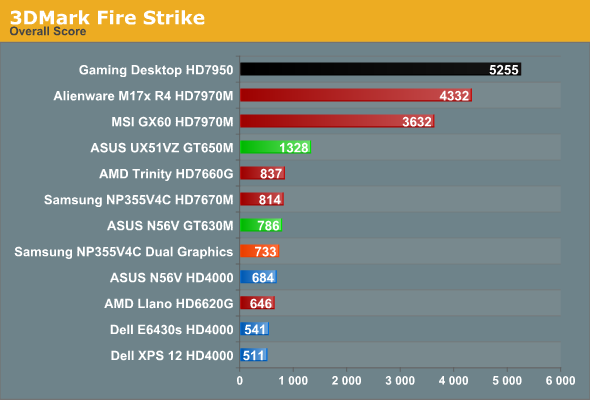
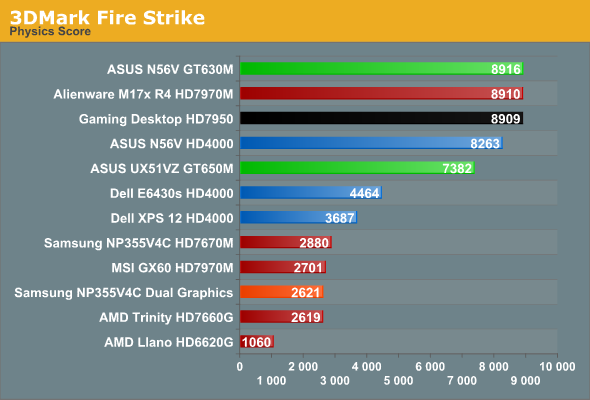
As expected, the desktop typically outpaces everything else, but the margins are a bit closer than what I experience in terms of actual gaming. Generally speaking, even with an older Bloomfield CPU, the desktop HD 7950 is around 30-60% faster than the mobile HD 7970M. Thanks to Ivy Bridge, the CPU side of the equation is actually pretty close, so the overall scores don’t always reflect the difference but the graphics tests do. The physics tests even have a few instances of mobile CPUs besting Bloomfield, which is pretty accurate—with the latest process technology, Ivy Bridge can certainly keep up with my i7-965X.
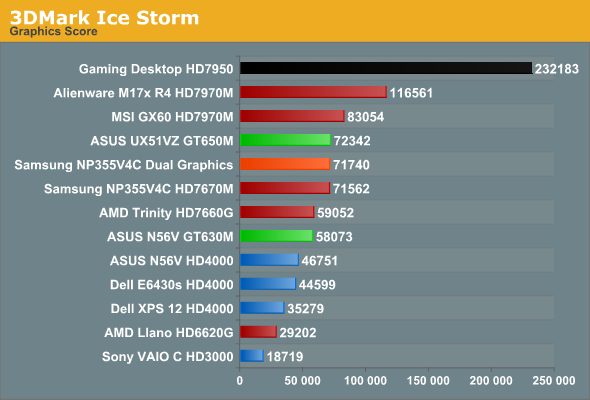
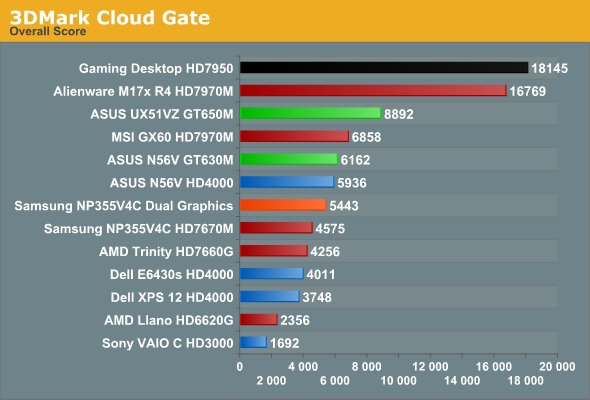
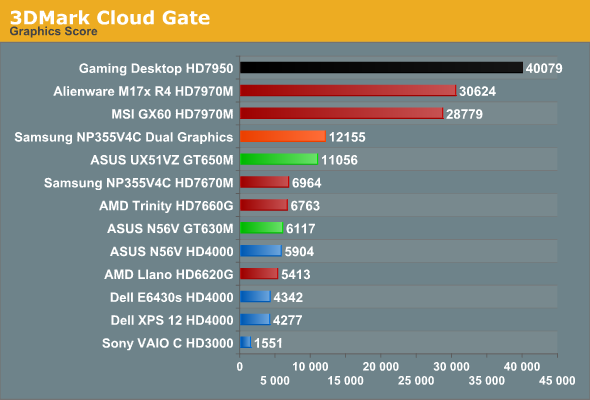
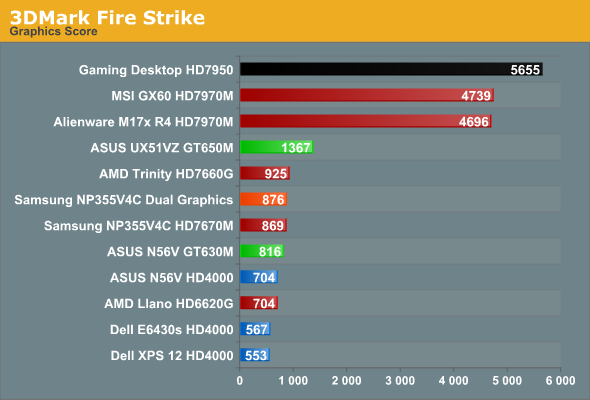
Moving to the mobile comparisons, at the high end we have two laptops with HD 7970M, one with Ivy Bridge and one with Trinity. I made a video a while back showing the difference between the two systems running just one game (Batman), and 3DMark again shows that with HD 7970M, Trinity APUs are a bottleneck in many instances. Cloud Gate has the Trinity setup get closer to the IVB system, and on the Graphics score the MSI GX60 actually came out just ahead in the Fire Strike test, but in the Physics and Overall scores it’s never all that close. Physics in particular shows very disappointing results for the AMD APUs, which is why even Sandy Bridge with HD 3000 is able to match Llano in the Ice Storm benchmark (though not in the Graphics result).
A look at the ASUS UX51VZ also provides some interesting food for thought: thanks to the much faster CPU, even a moderate GPU like the GT 650M can surpass the 3DMark results of the MSI GX60 in two of the overall scores. That’s probably a bit much, but there are titles (Skyrim for instance) where CPU performance is very important, and in those cases the 3DMark rankings of the UX51VZ and the GX60 are likely to match up; in most demanding games (or games at higher resolutions/settings), however, you can expect the GX60 to deliver a superior gaming experience that more closely resembles the Fire Strike results.
The Samsung Series 3 with Dual Graphics is another interesting story. In many of the individual tests, the second GPU goes almost wholly unused—note that I’d expect updated drivers to improve the situation, if/when they become available. The odd man out is the Cloud Gate Graphics test, which scales almost perfectly with Dual Graphics. Given how fraught CrossFire can be even on a desktop system, the fact that Dual Graphics works at all with asymmetrical hardware is almost surprising. Unfortunately, with Trinity generally being underpowered on the CPU side and with the added overhead of Dual Graphics (aka Asymmetrical CrossFire), there are many instances where you’re better off running with just the 7670M and leaving the 7660G idle. I’m still working on a full review of the Samsung, but while Dual Graphics is now at least better than what I experienced with the Llano prototype, it’s not perfect by any means.
Wrapping things up, we have the HD 4000 in three flavors: i7-3720QM, i5-3360M, and i7-3517U. While in theory they iGPU is clocked similarly, as I showed back in June, on a ULV platform the 17W TDP is often too little to allow the HD 4000 to reach its full potential. Under a full load, it looks like HD 4000 in a ULV processor can consume roughly 10-12W, but the CPU side can also use up to 15W. Run a taxing game where both the CPU and iGPU are needed and something has to give; that something is usually iGPU clocks, but the CPU tends to throttle as well. Interestingly, 3DMark only really seems to show this limitation with the Ice Storm tests; the other two benchmarks give the dual-core i5-3360M and i7-3517U very close results. In actual games, however, I don’t expect that to be the case very often (meaning, Ice Storm is likely the best representation of how HD 4000 scales across various CPU and TDP configurations).
HD 4000 also tends to place quite well with respect to Trinity and some of the discrete GPUs, but in practice that’s rarely the case. GT 630M for instance was typically 50% to 100% (or slightly more) faster than HD 4000 in the ASUS N56V Ivy Bridge prototype, but looking at the 3DMark results it almost looks like a tie. Don’t believe those relative scores for an instant; they’re simply not representative of real gaming experiences. And that is one of the reasons why we continue to look at 3DMark as merely a rough estimate of performance potential; it often gives reasonable rankings, but unfortunately there are times (optimizations by drivers perhaps) where it clearly doesn’t tell the whole story. I’m almost curious to see what sort of results HD 4000 gets with some older Intel drivers, as my gut is telling me there may be some serious tuning going on in the latest build.
Initial Thoughts on 3DMark “2013”
First, let me say that while I understand the reasoning behind eliminating the year/version from the name, I’m going to generally refer to this release as 3DMark 2013, as there will inevitably be another 3DMark in a year or two. With that out of the way, how does this latest release stand up to previous iterations, and is it a useful addition to the benchmark repertoire?
No benchmark is ever perfect, and even “real world gaming benchmarks” can only tell part of the story. As long as we keep that thought forefront when looking at the latest 3DMark, the results are completely reasonable. With the overall scores using both the Graphics and Physics tests, it will always be beneficial to have a fast CPU and GPU working together for 3DMark rather than pairing a fast GPU with a mediocre CPU, but I can’t say that such an approach is wrong—no matter what some companies might try to say, there are always potential uses for more CPU power in games (physics and AI immediately come to mind), though not every game will need a ton of CPU performance.
In terms of advancing the state of the benchmarking industry, it’s good to see the demo modes (cool graphics with sound are more enticing to the average person than a pure graphics benchmark). I also like the addition of graphs that show performance, power, temperatures, etc., though I wish they worked on all of the hardware rather than only some of the platforms. There’s at least the potential to now use 3DMark on its own to do stress testing without running additional utilities (HWiNFO or similar) in the background.
What I want to see now is how the various tablet and smartphone offerings stack up in comparison to the laptops that I’ve tested. Some people have mused that ARM and the latest SoCs are going to kill off the low end laptop market, but we’re still a ways from that happening, at least from a performance perspective. As slow as HD 3000 can be in comparison to other discrete GPUs, it’s probably still faster than any of the currently shipping SoC GPUs, and HD 4000 is another 50-100% faster than HD 3000. They both also use far more power, but when an iPad 4 includes a battery that holds as much power as many budget laptops, we’re not exactly talking about an insurmountable gulf.
What I really wish we had was more than one of the three tests to run on SoCs. Fire Strike is obviously too much for even notebook GPUs right now, but Cloud Gate ought to be able to run on the better SoCs. Ice Storm on the other hand is running at frame rates over 1000 on a high-end desktop GPU, so if that’s the only point of comparison with the SoCs we’re missing quite a bit of detail. Regardless, it will be nice to have another cross-platform benchmark where we can gauge relative performance, and that looks to be exactly what 3DMark provides.


